Figure 2. Wild-type rod opsin expression
in control and sCnx cells. Wild-type (WT) rod opsin-green fluorescent
protein (GFP; WT-GFP) translocates to the plasma membrane of WT (A)
and calnexin (sCnx) cells (B). Scale bar equals 10 μm. C:
western blotting of untagged rod opsin with mAb 1D4 of 15 μg of soluble
protein from WT or sCnx cell lysates (as indicated) revealed no
difference in immunoreactive opsin band pattern. This representative
blot was selected because of the similar rod opsin expression level
between WT and sCnx cells to better demonstrate similar band pattern.
The position of molecular weight markers in kDa are indicated on the
left. D: Quantification of inclusion incidence for WT-opsin-GFP
expressing cells after 24 h revealed no significant difference in
WT-opsin-GFP aggregation in sCnx cells. Five groups of greater than 100
cells expressing WT-opsin-GFP opsin were scored for the presence of
inclusions (the remaining cells had predominantly plasma membrane
staining). Error bars represent ±2 Standard Error (SEM). Statistical
analysis was performed by ANOVAR followed by posthoc tests. The
asterisk indicates p<0.05.
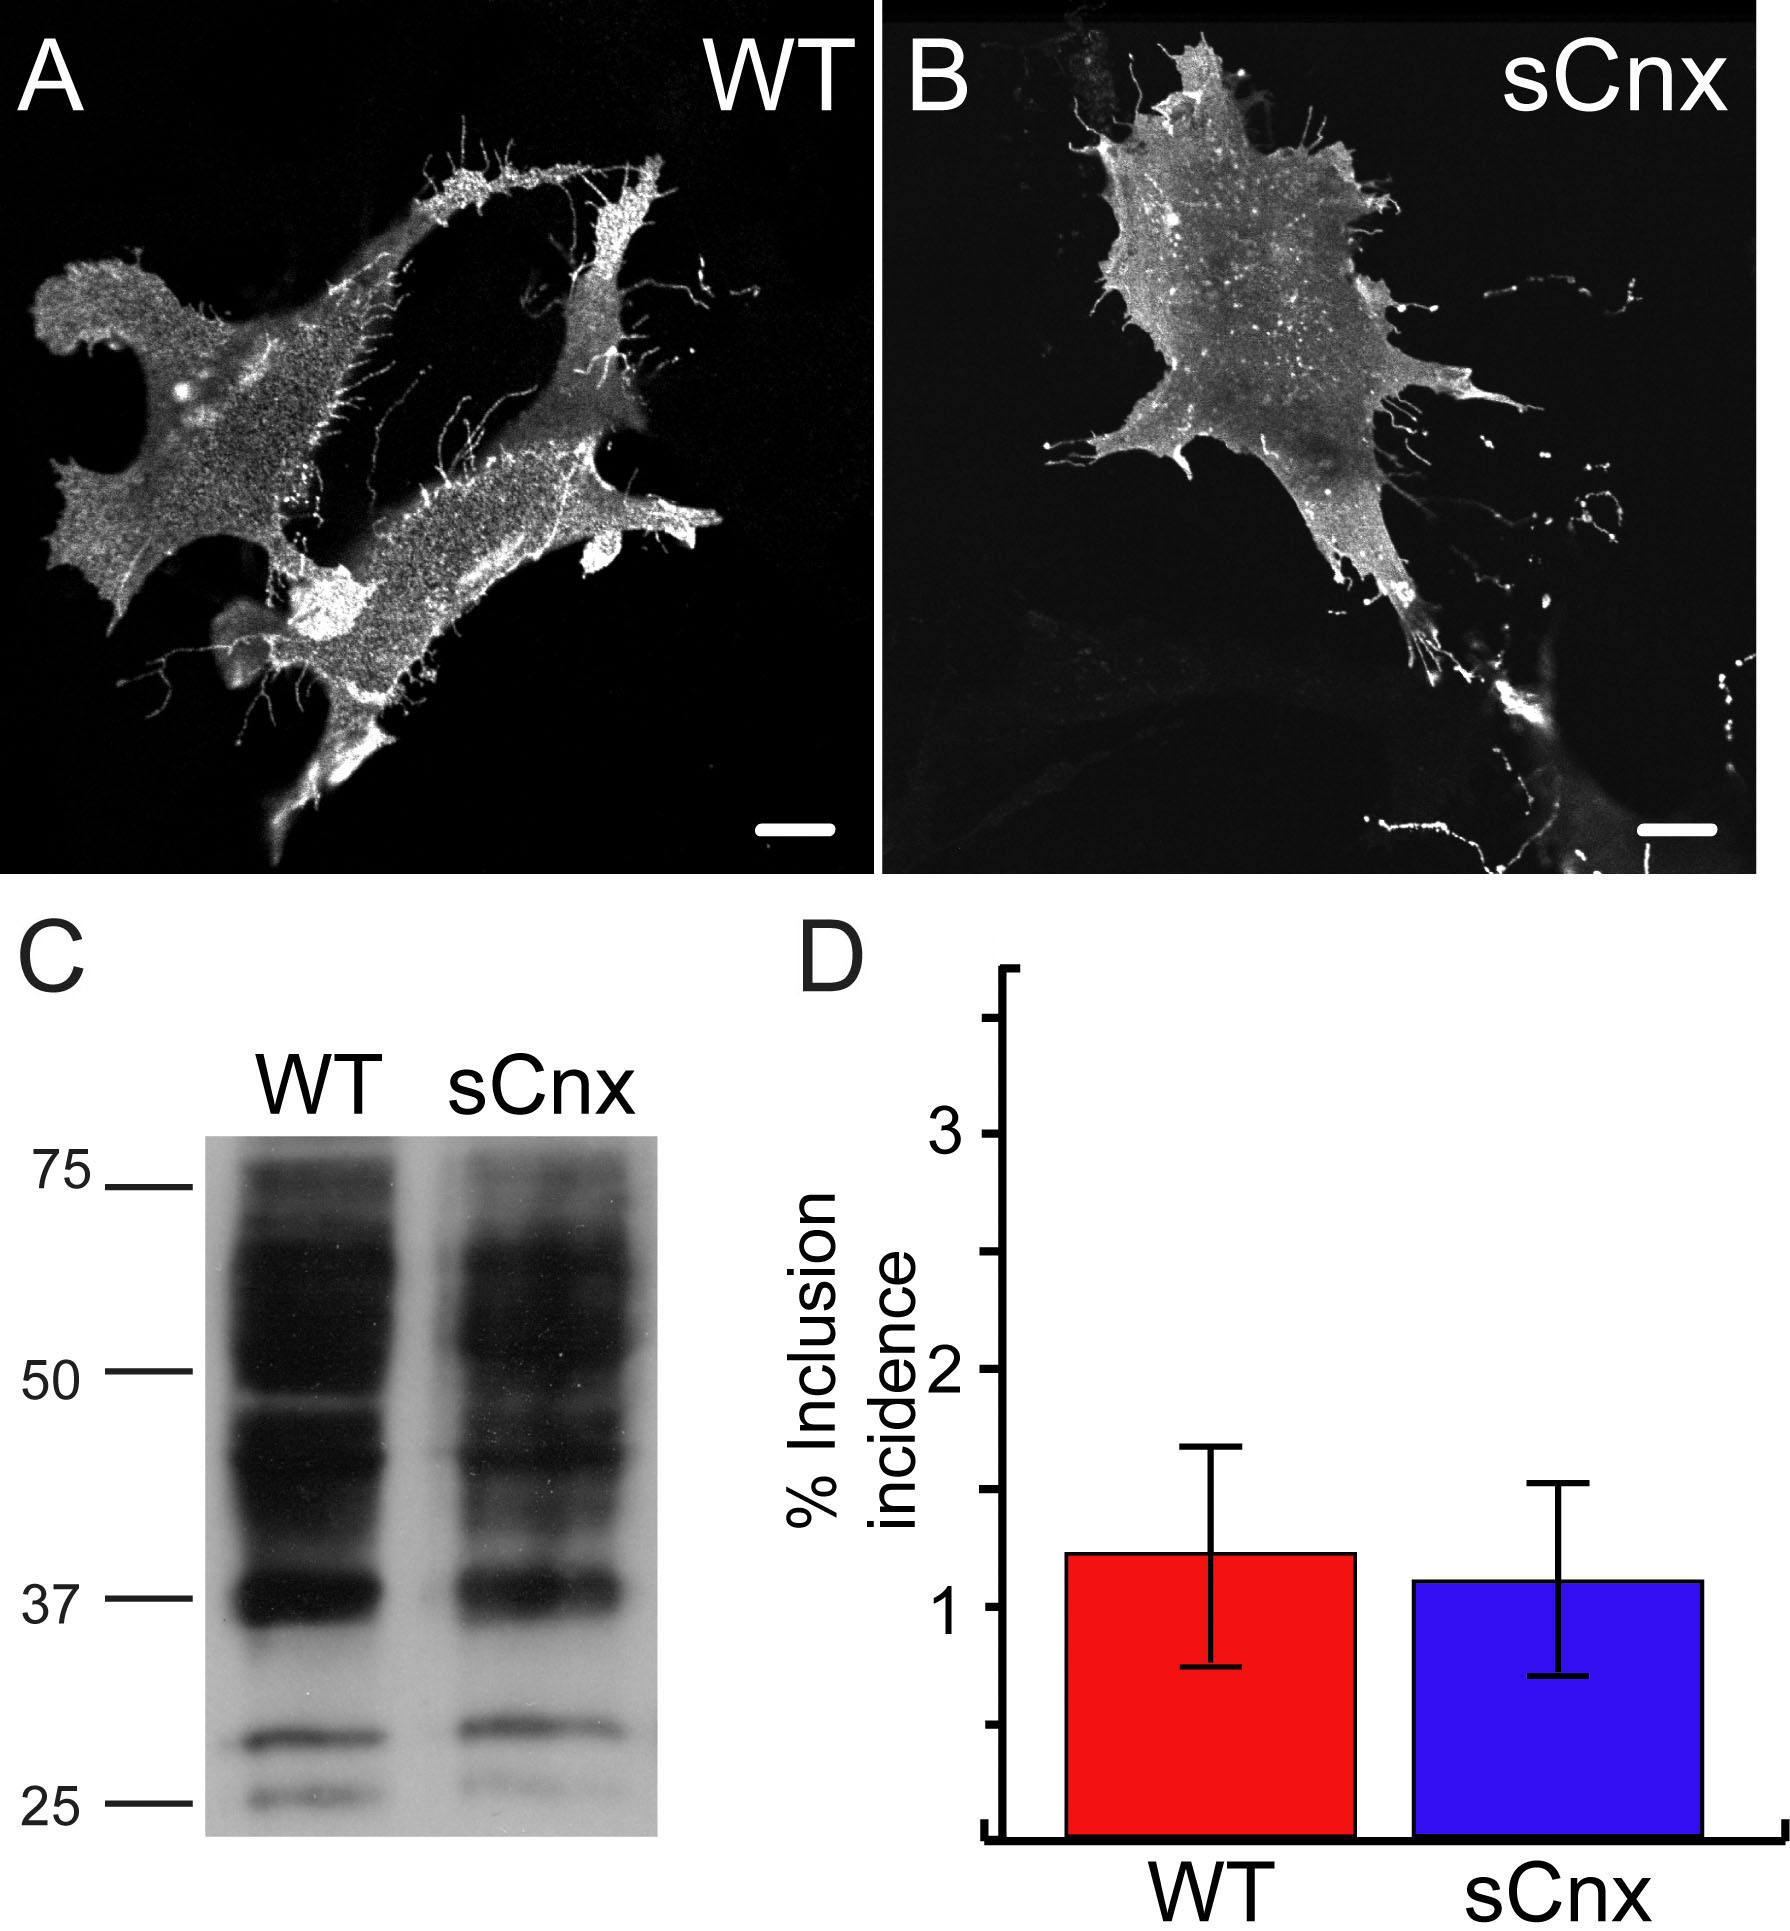
 Figure 2 of Kosmaoglou, Mol Vis 2008; 14:2466-2474.