Figure 4. RT–PCR and direct sequencing analysis for the splice site mutation c.985–2A>G. A: Ethidium bromide-agarose gel was loaded with RT–PCR products generated from leukocytes of total RNA of three affected members
(two bands) and seven unaffected individuals (one band) of family F1. B and C: The sequence chromatograms of the two bands from the patient’s RT–PCR products; B: The mutant transcript sequence with the skipping exon 10. C: The corresponding normal transcript sequence between exon 9 and exon 11.
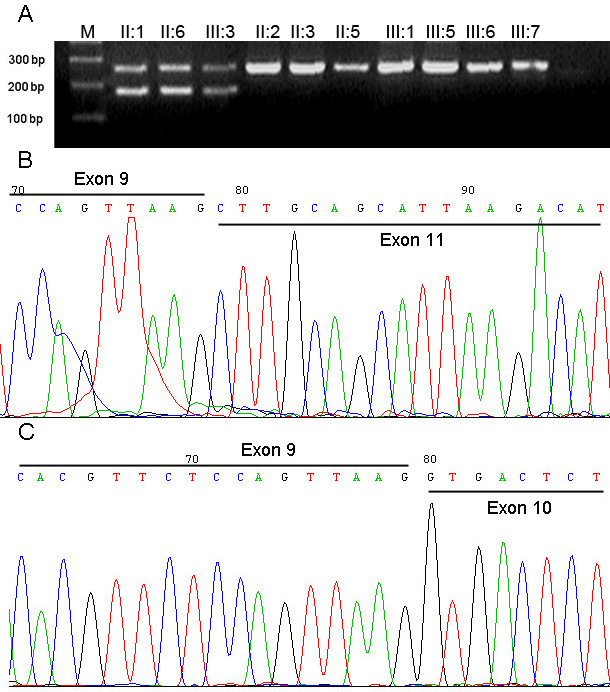
 Figure 4 of
Li, Mol Vis 2008; 14:2451-2457.
Figure 4 of
Li, Mol Vis 2008; 14:2451-2457.