Figure 1. Family structure and haplotype analysis of the two Chinese families with ADOA. Pedigree of the two families with autosomal
dominant optic atrophy (ADOA) and haplotype analysis of the family F1 showed segregation two microsatellite markers on chromosome
3 listed in descending order from the centromeric end. Squares indicate males; circles indicate females; slashed symbols indicate
deceased; solid symbols indicate affected; open symbols indicate unaffected; and arrow symbol indicates proband.
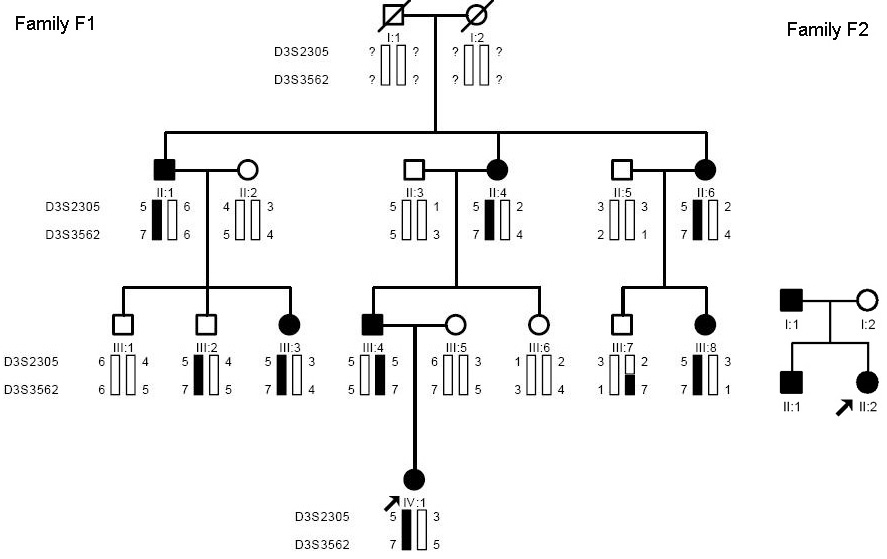
 Figure 1 of
Li, Mol Vis 2008; 14:2451-2457.
Figure 1 of
Li, Mol Vis 2008; 14:2451-2457.