Figure 1 of
Guy, Mol Vis 2008; 14:2443-2450.
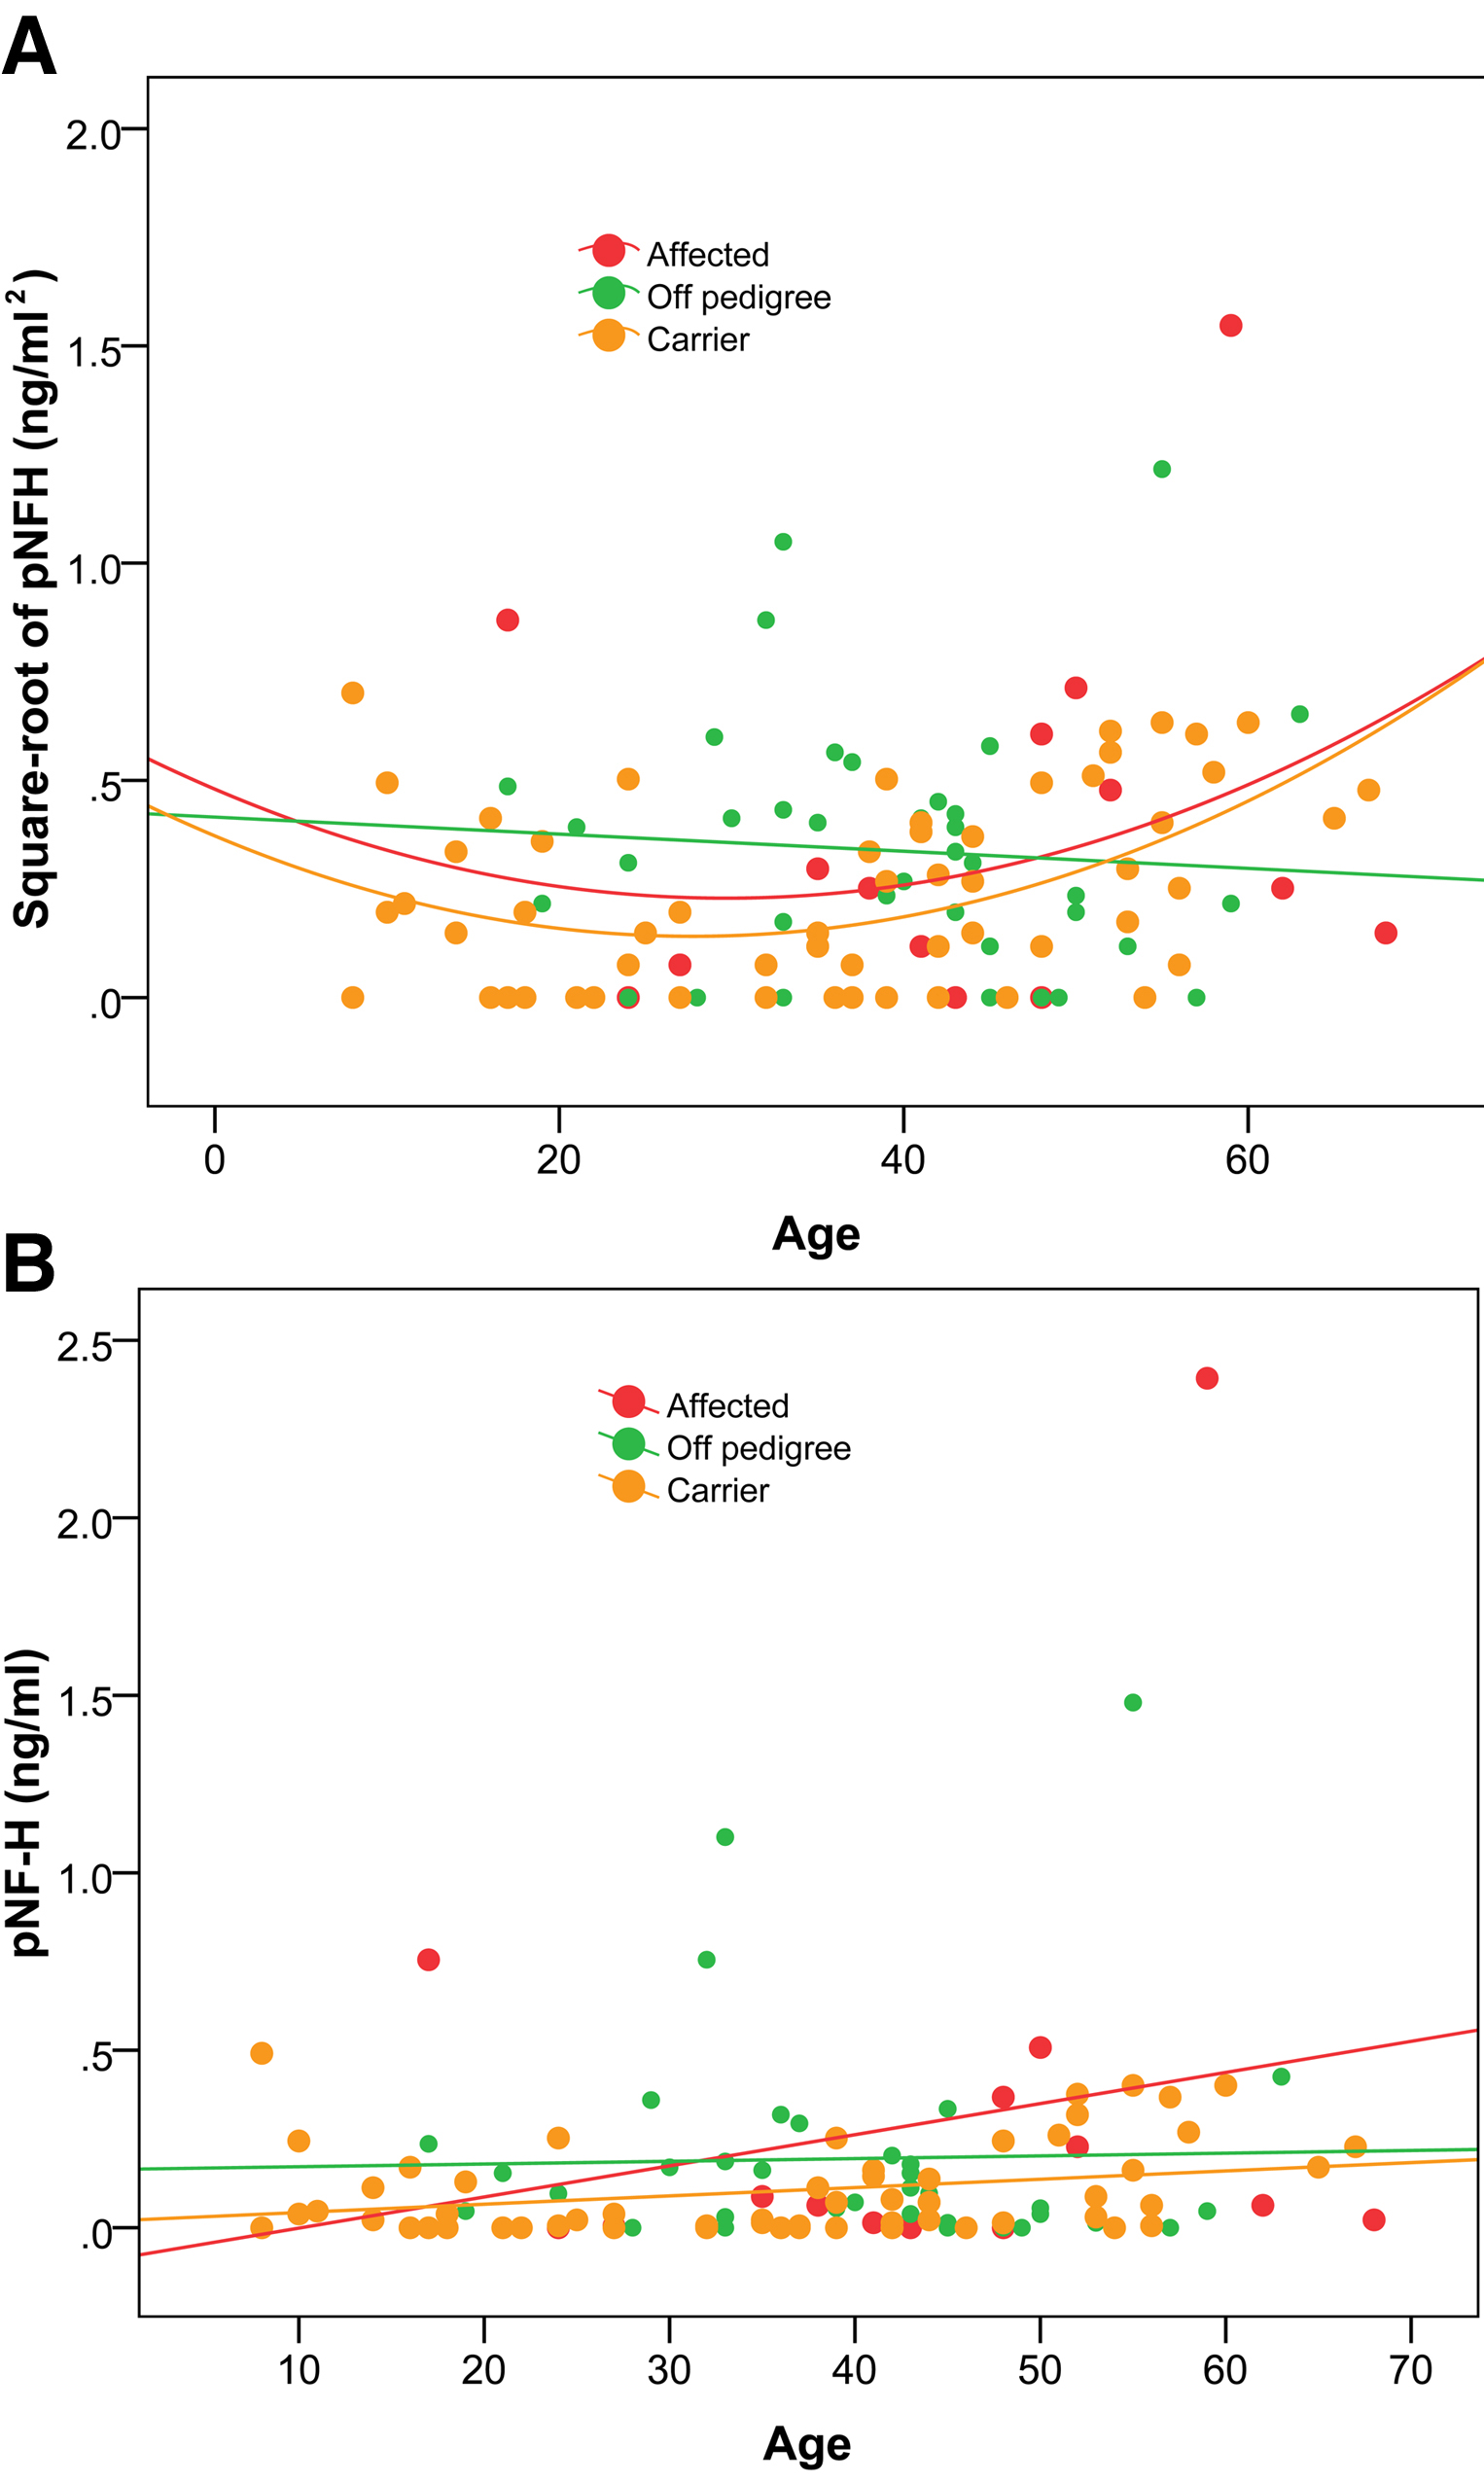
Figure 1.
pNF-H levels versus age. Plots of the square root of pNF-H (ng/ml
2
;
A
) and pNF-H (ng/ml;
B
) show that pNF-H levels increase with advancing age of carriers and affected patients but not in the off-pedigree control group.
 Figure 1 of Guy, Mol Vis 2008; 14:2443-2450.