Figure 4. Dlg1, Scrib, and Lgl1
mRNA and protein expressions in mouse whole eyes during tumor
development and in control eyes. Semi-quantitative RT–PCR was used to
determine the relative amounts of Dlg1 (A), Scrib
(C), and Lgl1 (E) mRNA in mouse whole eye tissue
at P25, P30, and three months in CB6 control and Trp1/Tag mice. Cyclophilin
was used as an internal control. Relative levels were calculated as the
ratio of the intensity of each PCR band to the cyclophilin
band. B, D, and F shows means of the ratio of
expression corresponding to A, C, and E,
respectively. G shows corresponding western blot analysis. The
blot was counterstained with anti-β-actin antibody as a loading
control. Specific bands corresponding to Dlg1 (140 kDa), Scrib
(210 kDa), Lgl1 (112 kDa), and β-actin (42 kDa) were
detected in all extracts. H shows the relative levels of each
protein, which were quantified and normalized using β-actin as the
internal standard. I shows E-cadherin and N-cadherin
expressions using RT–PCR in control and TRP1/Tag mice. Error bars
indicate SEM. Asterisks indicate statistically significant results
(p<0.001). Dlg1, Scrib, and Lgl1 protein levels were reduced in the
whole eye from the adenocarcinoma model at P30 whereas only Dlg1 and
Scrib protein were reduced at three months (G,H).
E-cadherin expression in total RNA samples extracted from whole eyes
was much lower in the Trp1/Tag model than in the control mice at the
P30 and three month stages (H). An upregulation of N-cadherin
expression was associated with E-cadherin downregulation at these
stages (I).
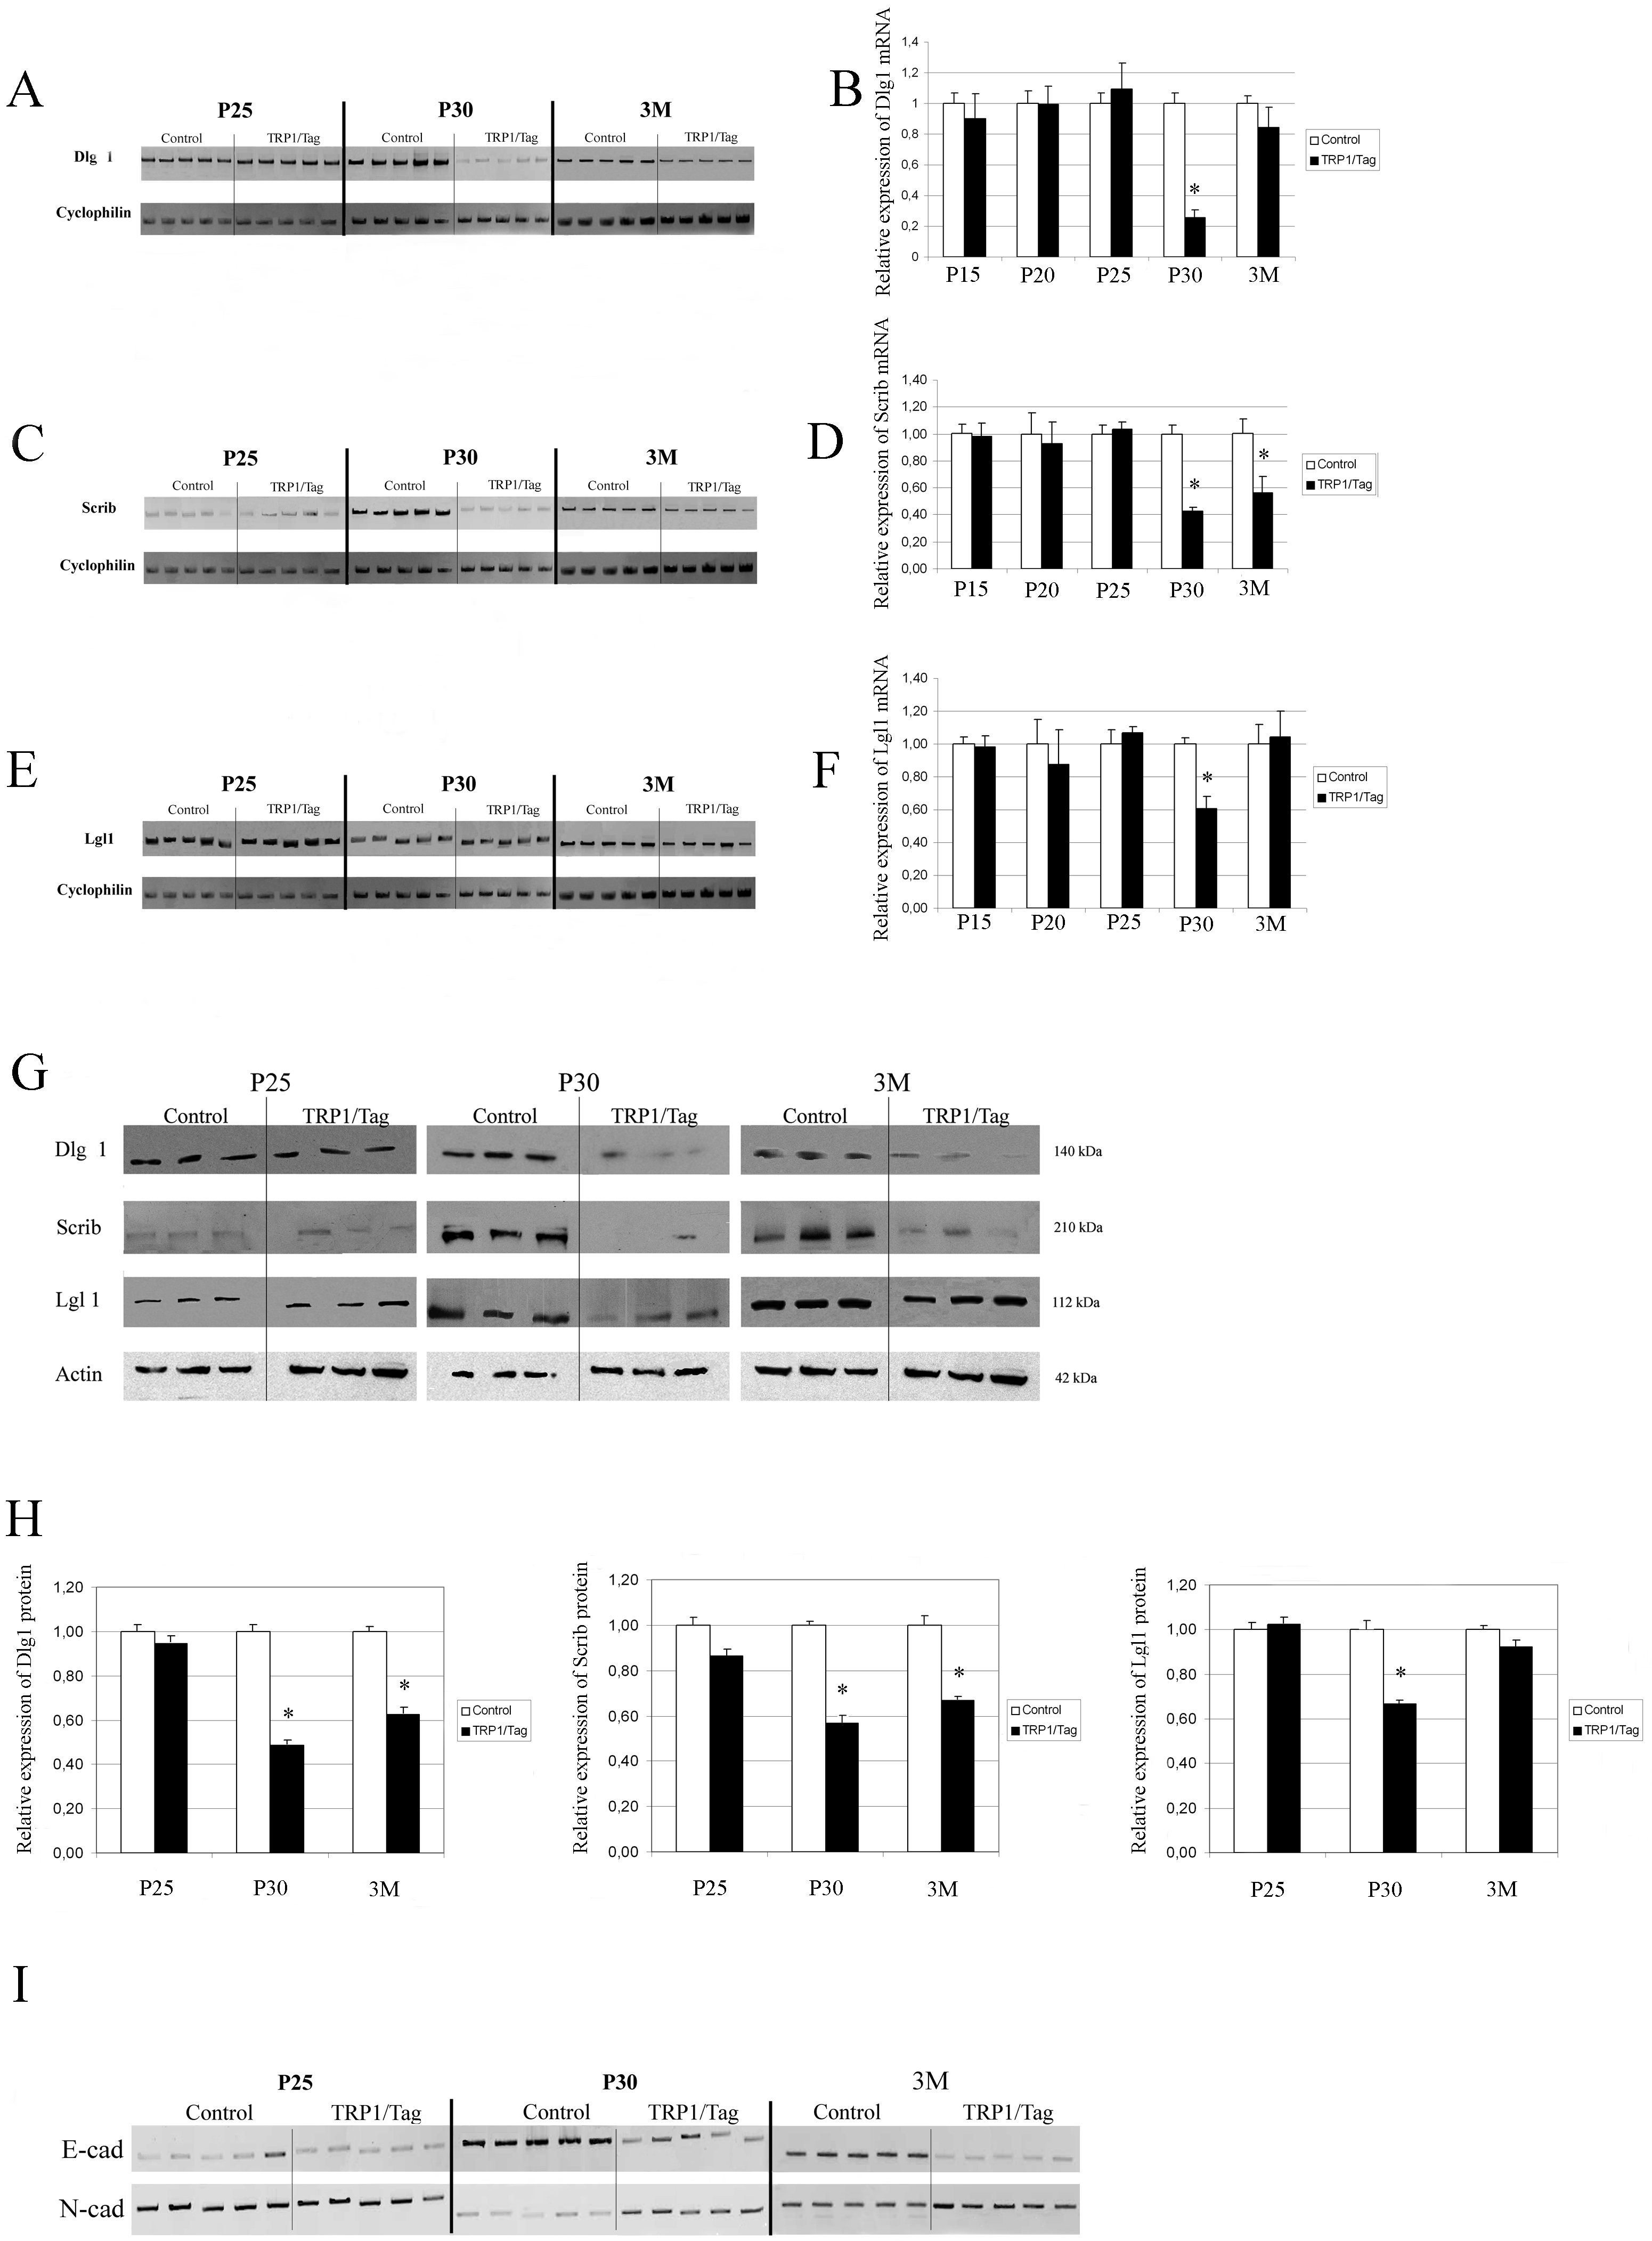
 Figure 4 of Vieira, Mol Vis 2008; 14:2390-2403.