Figure 5. Effect of rhBMP-2 on mRNA expression levels of MMP-2 and TIMP-2 in human sclera fibroblasts. Ethidium-bromide agarose gels
indicated the level of β-actin message relative to MMP-2 (A) and TIMP-2 (B) levels from total RNA. Bar graphs revealed changes in mRNA expression (mean±standard error of the mean) where values were
normalized to β-actin values and expression was stated as a ratio of optical density. The double asterisk means that the semi-quantitative RT-PCR
revealed significant changes for MMP-2 and TIMP-2 with varying concentrations of rhBMP-2 (p<0.01).
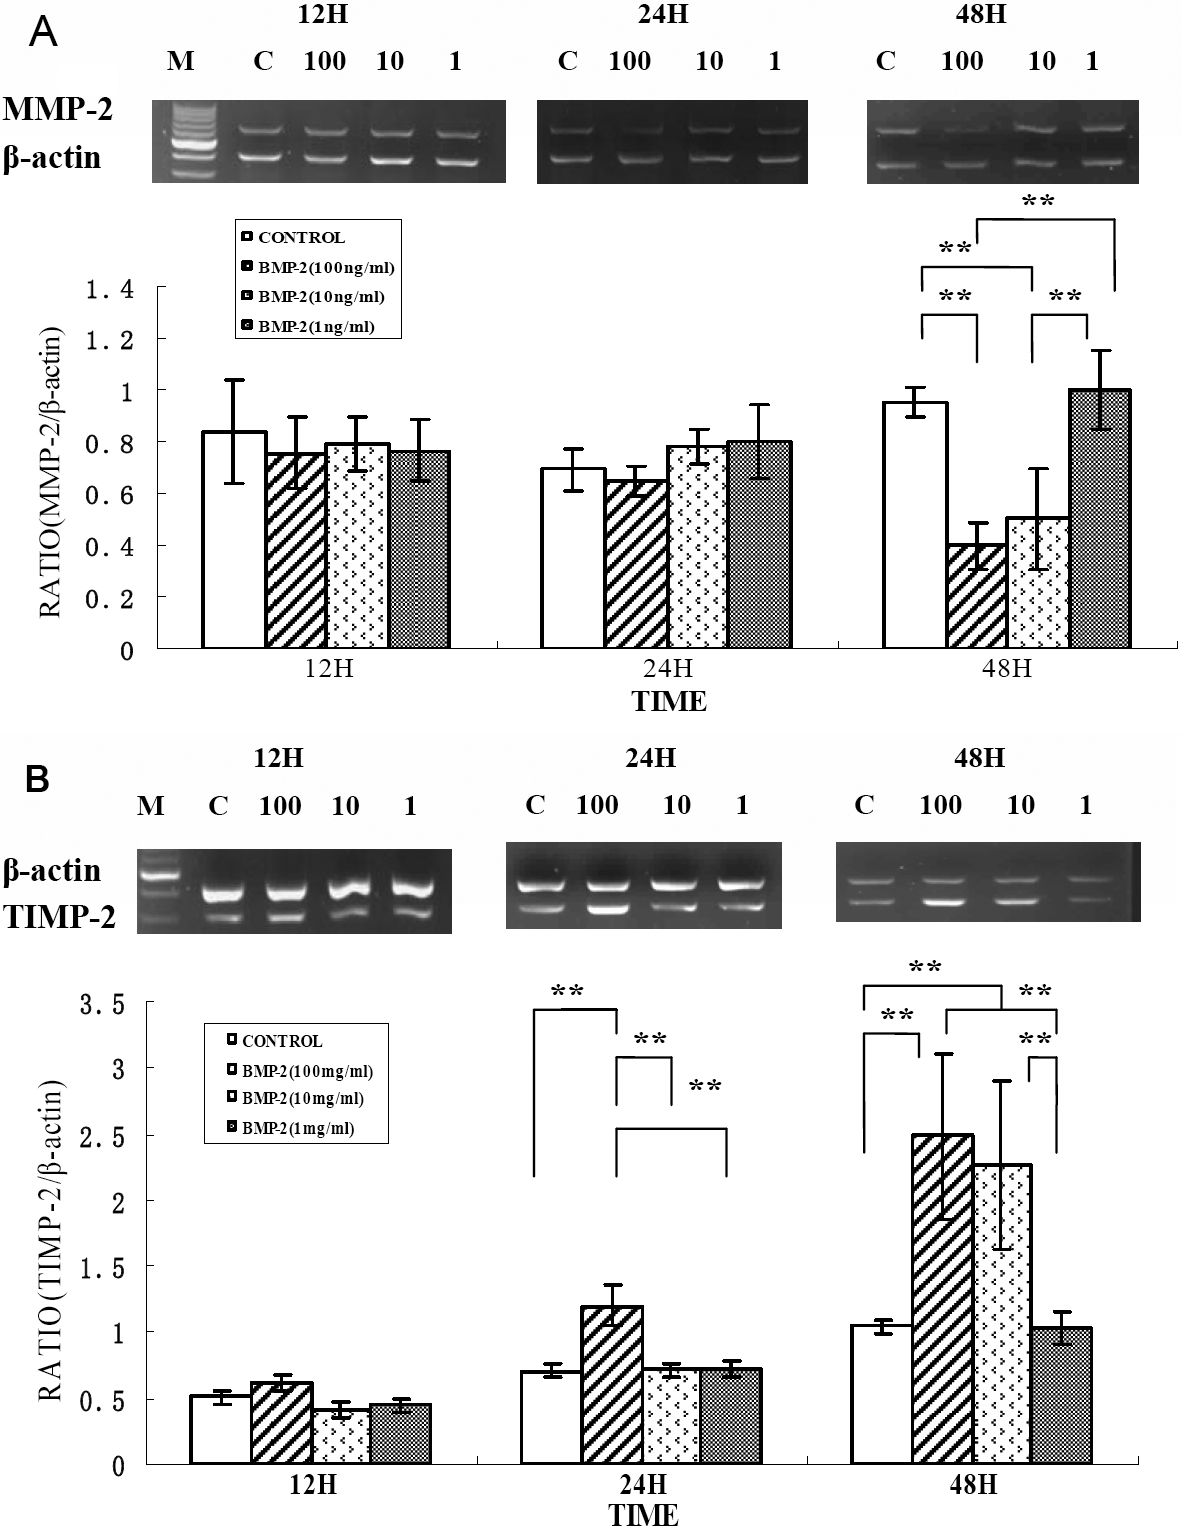
 Figure 5 of
Hu, Mol Vis 2008; 14:2373-2380.
Figure 5 of
Hu, Mol Vis 2008; 14:2373-2380.