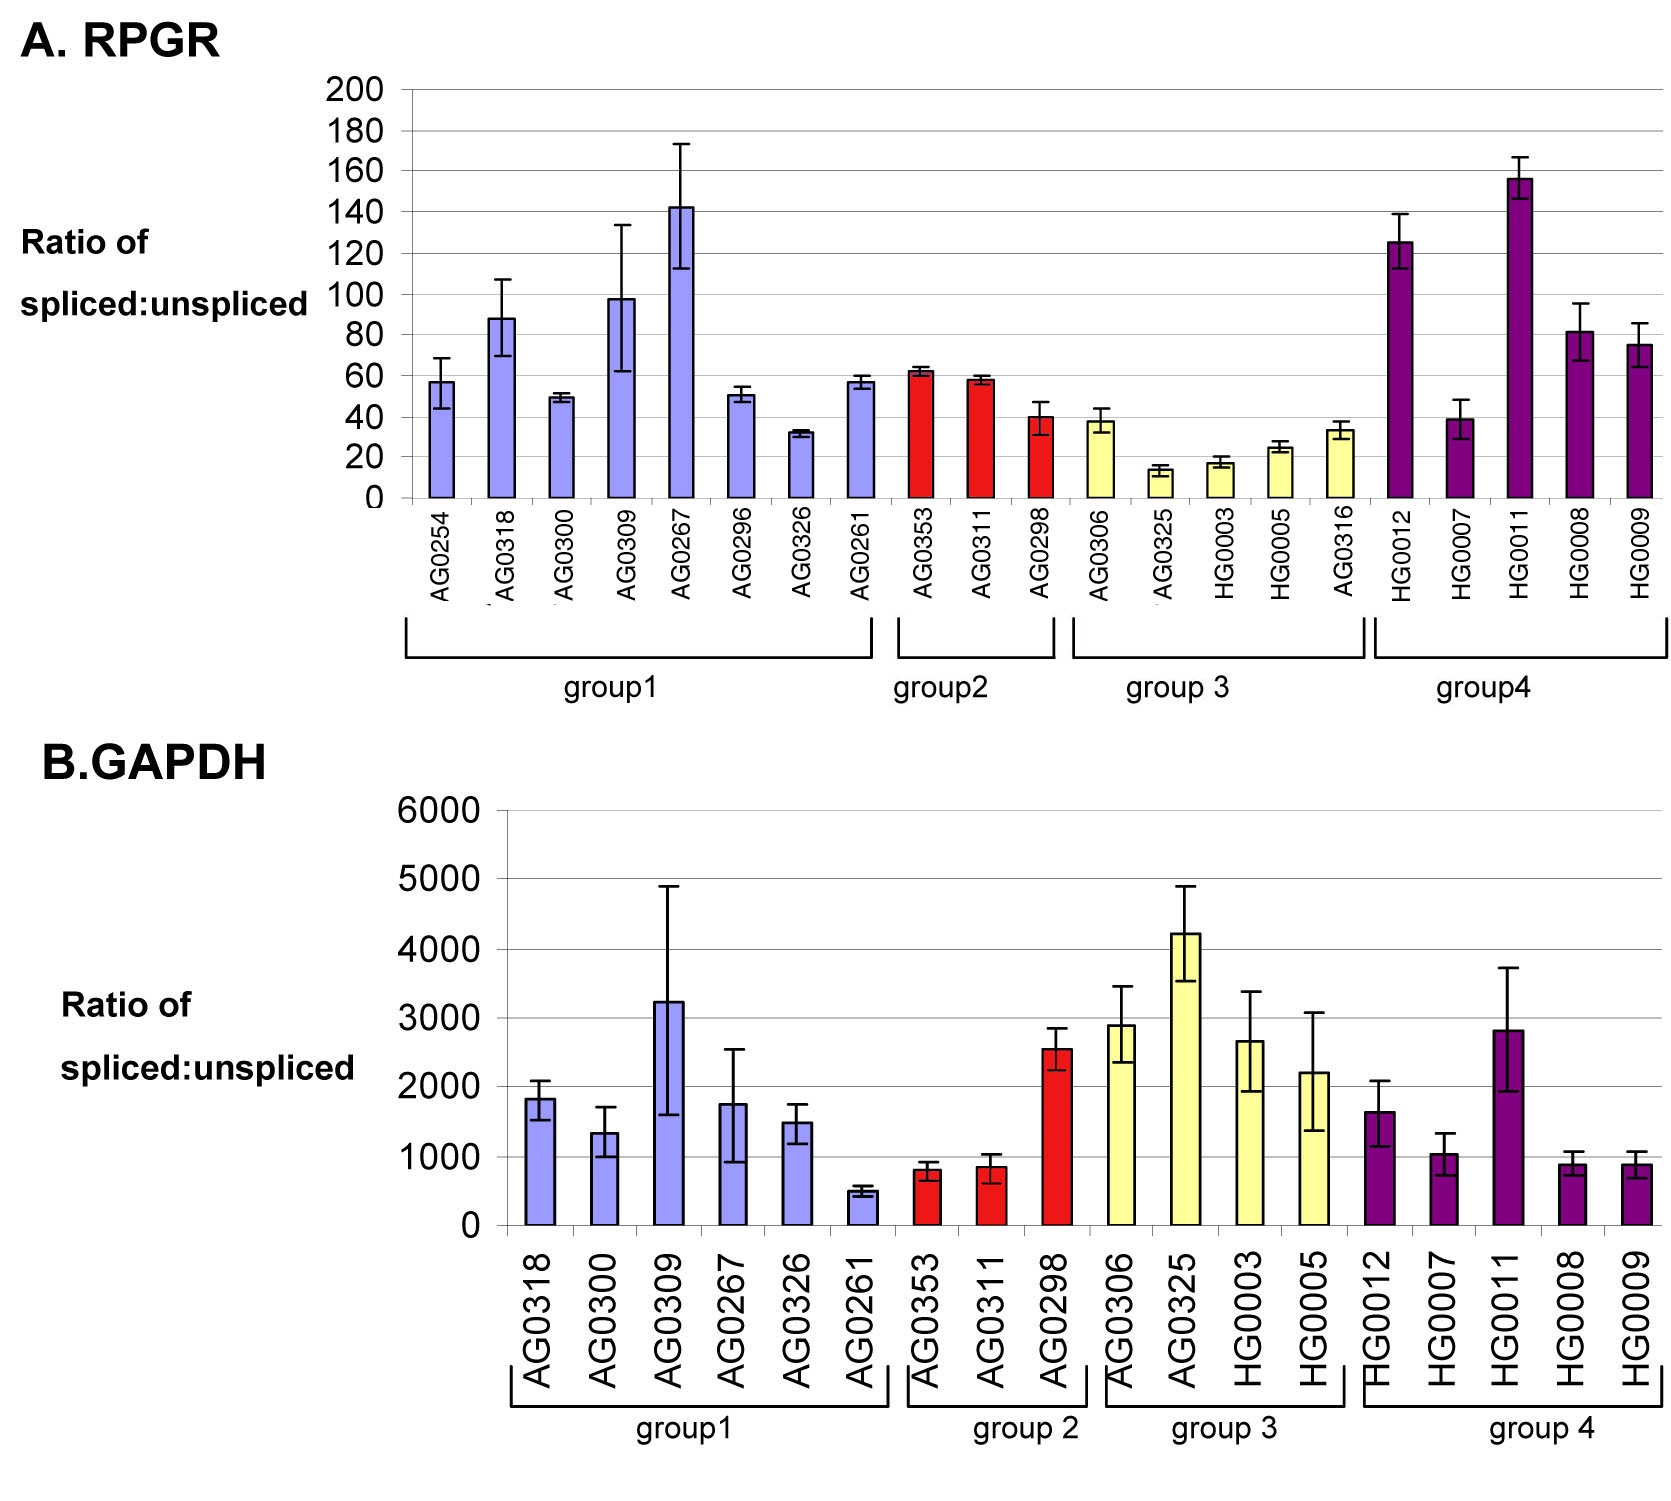
Figure 1. Splicing ratios of U2.
Splicing ratios of U2 containing introns
RPGR (
A) and
GAPDH
(
B) RNA in cell lines derived from control and splicing-factor
mutated cell lines. Group 1 represents controls, group 2 represents
PRPF31 carriers, group 3 represents PRPF31 severe, and group 4
represents PRPF8 cell lines. The splicing ratios were obtained as
described in the Methods section. Means from four to six repeat
experiments are shown ±SEM. For individual cell line characteristics
see
Table 1.
 Figure 1 of Ivings, Mol Vis 2008; 14:2357-2366.