Figure 2. Results of microarray-based PrASE genotypings. Cluster diagrams of genotyping results of 105 individuals for four common CYP1B1 mutations are shown. Red squares: PCG patients whose genotypes were known because of previous direct sequencing. Blue squares:
POAG patients whose genotypes were determined by the PrASE/hybridization reactions.
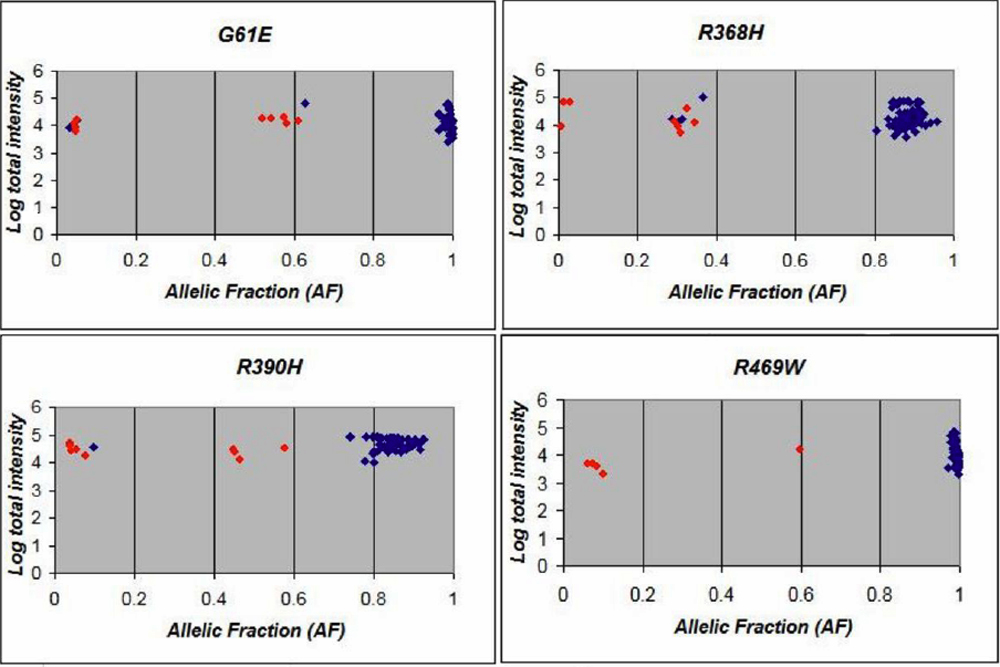
 Figure 2 of
Suri, Mol Vis 2008; 14:2349-2356.
Figure 2 of
Suri, Mol Vis 2008; 14:2349-2356.