Figure 1. Electrophysiological
measurements of BK channels in ARPE-19 cells. A: Shown is the
pulse protocol used to measure Ca2+-activated potassium
currents. From a holding potential of −40 mV the cells were stimulated
by 20 potential steps of 50 ms duration from −130 mV with 10 mV
increment. B: Shown are control currents evoked in Ringer
solution by the pulse protocol shown in A. C: Shown is
the same cell as in A in the presence of the specific BK
channel antagonist iberiotoxin (100 nM). D: Shown is the
iberiotoxin-sensitive current of the same cell (A-B). E:
The current-voltage relationship of the steady-state current displayed
here, illustrates that only outward current was blocked by iberiotoxin.
Shown are the data from the cell measured in A-C.
Abbreviations: Control without iberiotoxin represents ●;
iberiotoxin-insensitive represents ■; iberiotoxin-sensitive represents
▼. F: The comparison of current densities at +50 mV measured
before and after application of 100 nM iberiotoxin illustrates the
reduction of outward currents by the addition of the blocker (n=6). G:
Shown here is the current-voltage relationship of normalized mean
iberiotoxin-sensitive currents fitted with a Boltzmann equation
(V1/2=5.23 mV, k=9.58 mV, n=4).
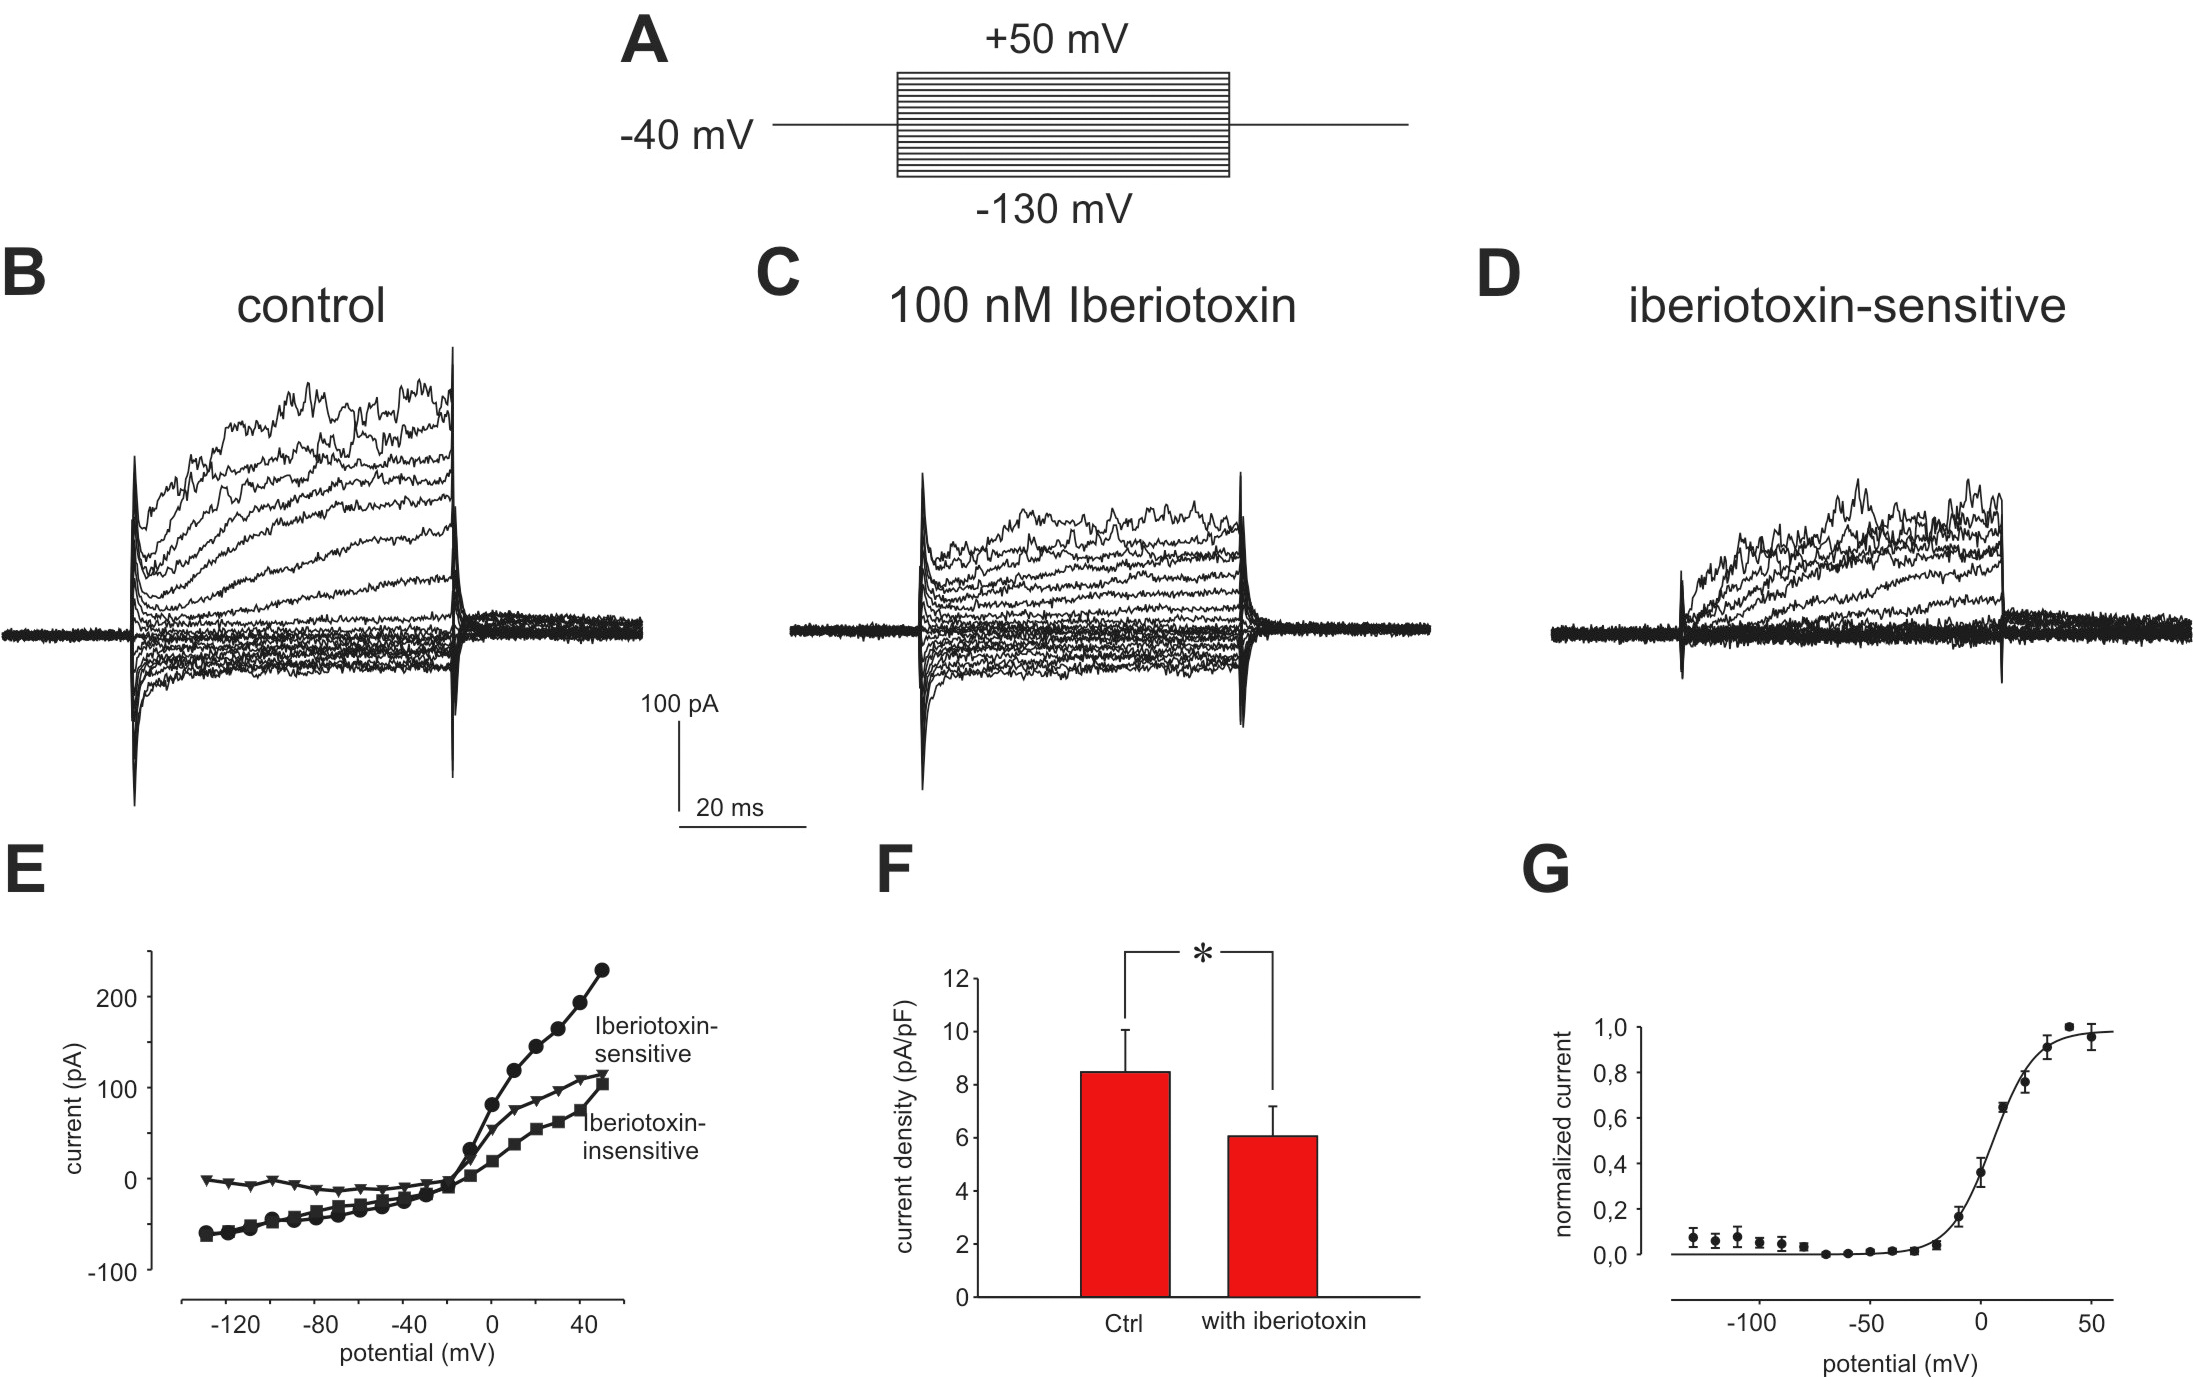
 Figure 1 of Wimmers, Mol Vis 2008; 14:2340-2348.