Figure 8. Distribution of different mutations with relevant BCVA (A), FT (B), standard combined b-wave amplitudes of full field ERG (C), and age. Age (yrs) is showed by numbers beside symbols characterizing the type of mutations in each eye. Mean values of
controls are shown by the horizontal black broken line and the ±SD by a horizontal dark gray stripe. A: BCVA values belonging to a certain mutation were variable irrespective of age. The best and the worst BCVA belonged to two
adjoining mutations (c.422G>A, c.421C>T). B: FT values change irrespectively of the type of mutation, but after 26 years of age, almost exclusively the atrophic form
is detectable by OCT. C: The decrease of standard combined b-wave amplitudes belonging to a certain type of mutations were also different, irrespective
of age.
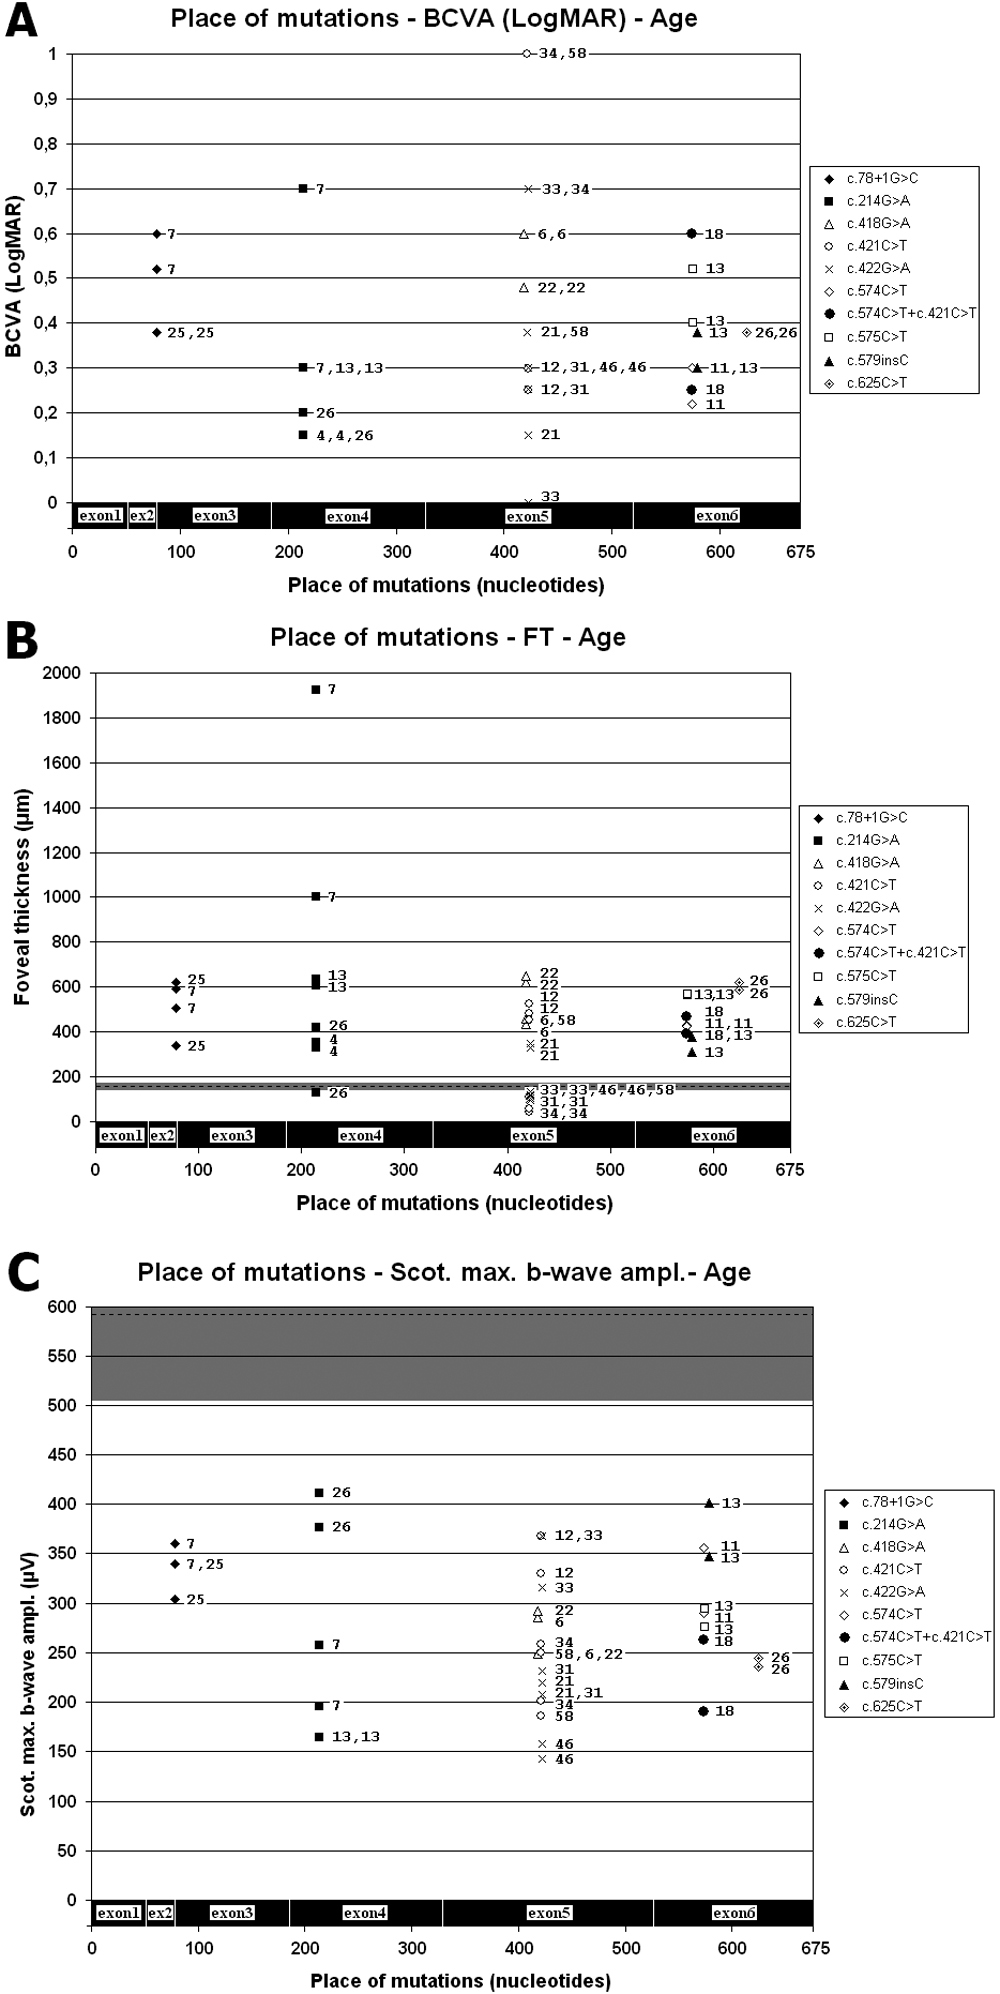
 Figure 8 of
Lesch, Mol Vis 2008; 14:2321-2332.
Figure 8 of
Lesch, Mol Vis 2008; 14:2321-2332.