Figure 7. Mean values of response
densities and implicit times of mfERGs for five eccentric rings in
controls, carriers, and patients. Gray area represents standard
deviation. Red lines highlight significant changes compared with the
controls. A: Response densities of patients were significantly
decreased (p<0.05) in all rings (especially in central rings)
compared with the controls, with no significant difference found
between the two patient groups. B: Implicit times of patients
were significantly increased (p<0.05) only in the peripheral part of
the examined retinal area (rings 3–5) compared with the controls, with
no significant difference observed between the two patient groups. In
carriers, response densities and implicit times were within the normal
range.
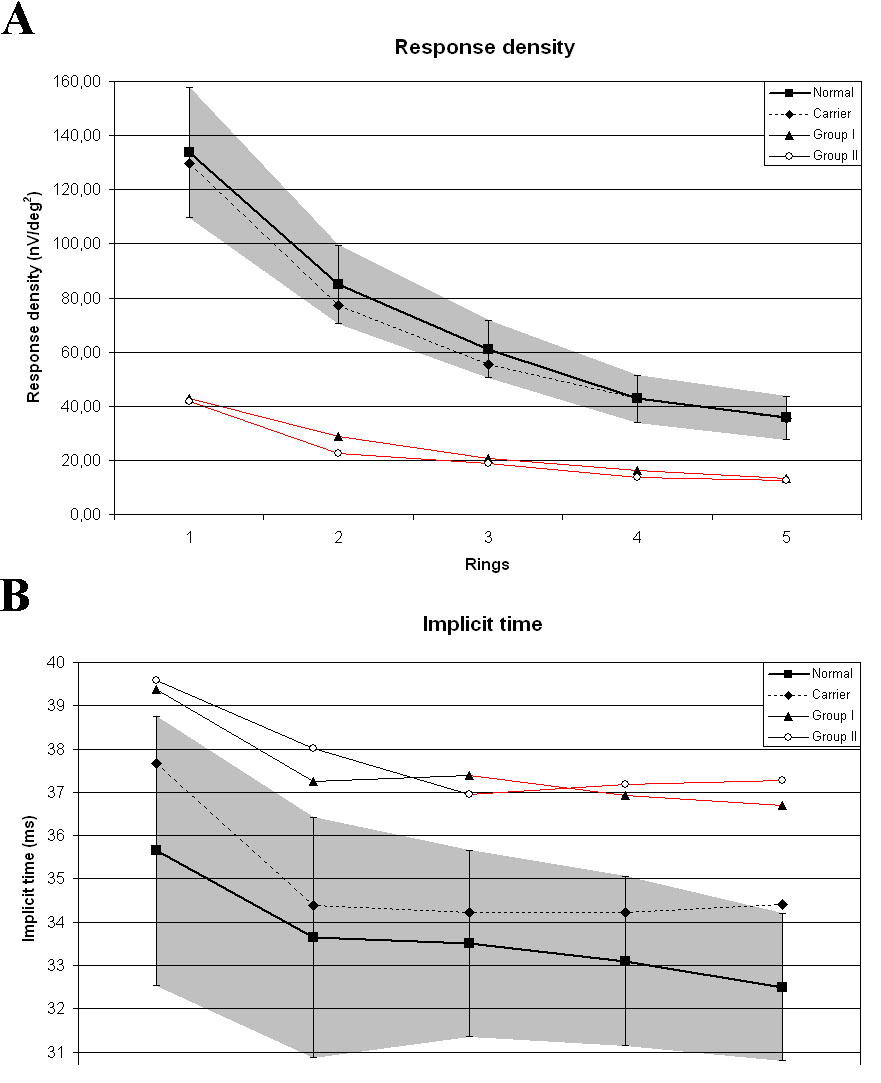
 Figure 7 of Lesch, Mol Vis 2008; 14:2321-2332.