Figure 2. Identified mutations, their frequency in the RS1 gene, and the retinoschisis protein. In the gene diagram, exons are represented by bars (gray numbers indicate their numbers;
black numbers indicate their size in nucleotides), and introns by lines. Mutations and their localizations in the gene and
the protein are marked by gray lines. In the protein diagram, leader sequence is abbreviated LS. Frequency of different types
of mutations within each exon and intron are indicated by red bars.
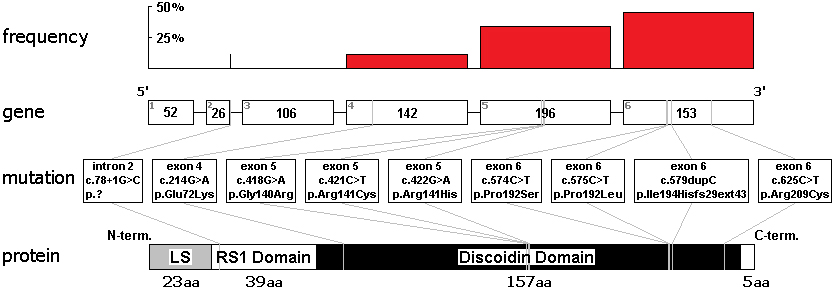
 Figure 2 of
Lesch, Mol Vis 2008; 14:2321-2332.
Figure 2 of
Lesch, Mol Vis 2008; 14:2321-2332.