Figure 6. Reprogrammed cells showed
responses to exogenous glutamate. A, B: The ΔF/Fo of each of
two reprogrammed cells in an retinal pigment epithelium (RPE) cell
culture infected with Replication Competent Avian Splice (RCAS)-achaete-scute
homolog 1 (ash1) was plotted against time (in seconds) to
produce response curves. C, D: The ΔF/Fo of each of two retinal
cells in an E16 chick retinal cell culture was plotted against time (in
seconds) to produce response curves as reference to those of
reprogrammed cells. E, F: The ΔF/Fo of each of two RPE cells in
the control culture infected with RCAS was plotted against time to
produce response curves as negative controls. While no responses were
observed with RPE cells, reprogrammed cells responded to glutamate and
the response curves were similar to that of retinal cells. The arrow in
each plot points to the time at which the neurotransmitter was applied.
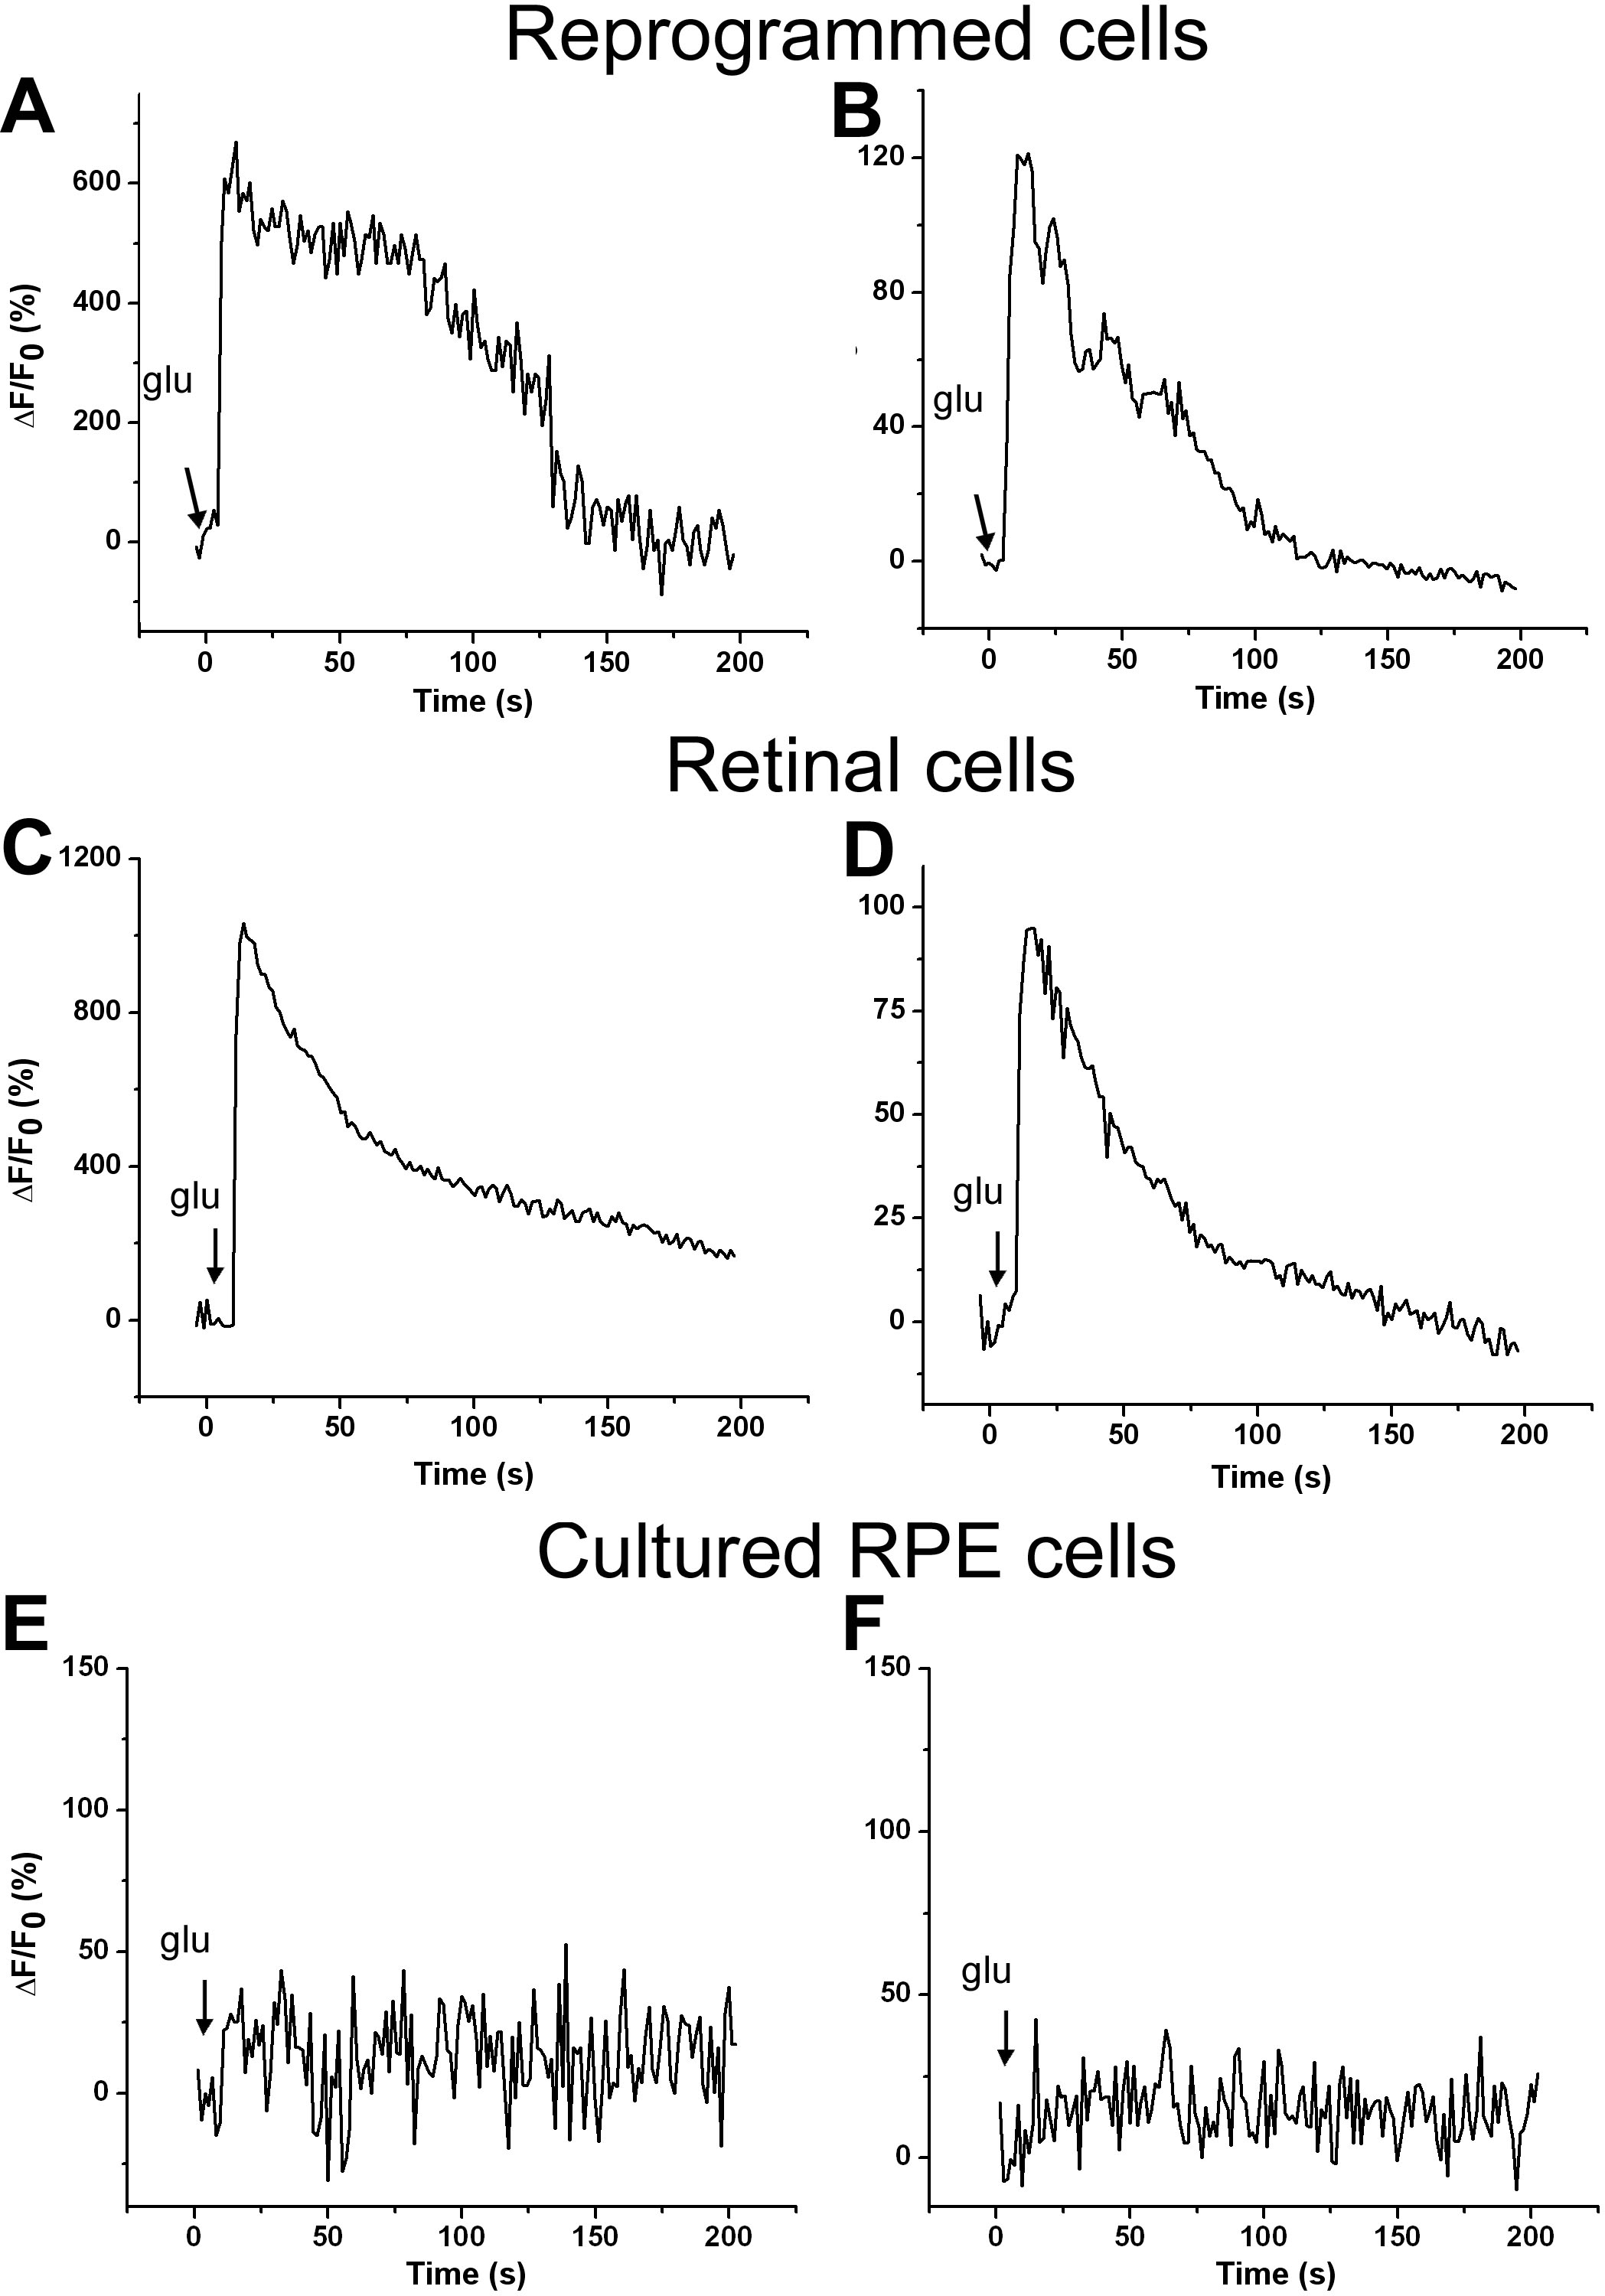
 Figure 6 of Mao, Mol Vis 2008; 14:2309-2320.