Figure 5. Reprogrammed cells responded to
NDMA+glycine. A: Montage of fluorescence micrographs is shown
to illustrate responses by two reprogrammed cells (arrows) in an
retinal pigment epithelium (RPE) cell culture infected with RCAS-ash1.
The image in the first panel was captured with longer exposure time for
a clear view of the cells. Time (in seconds) after the application of
the neurotransmitter is shown at the bottom of each panel. B, C:
The ΔF/Fo of each of the two cells identified in A was plotted
against time (in seconds) to produce a response curve. D: The
ΔF/Fo a retinal cell in an E16 chick retinal cell culture was plotted
against time to produce a response curve as a reference for the
reprogrammed cells. E: The ΔF/Fo of a cell in the control RPE
culture infected with RCAS was plotted against time to produce a
response curve as a negative control. While no response was observed
with RPE cells, reprogrammed cells responded to NDMA+glycine by
transiently increasing Ca2+ concentrations, similar to the
responses by retinal cells. The arrow in B-E points to the time
at which the neurotransmitter was applied. Scale bars represents 50 μm.
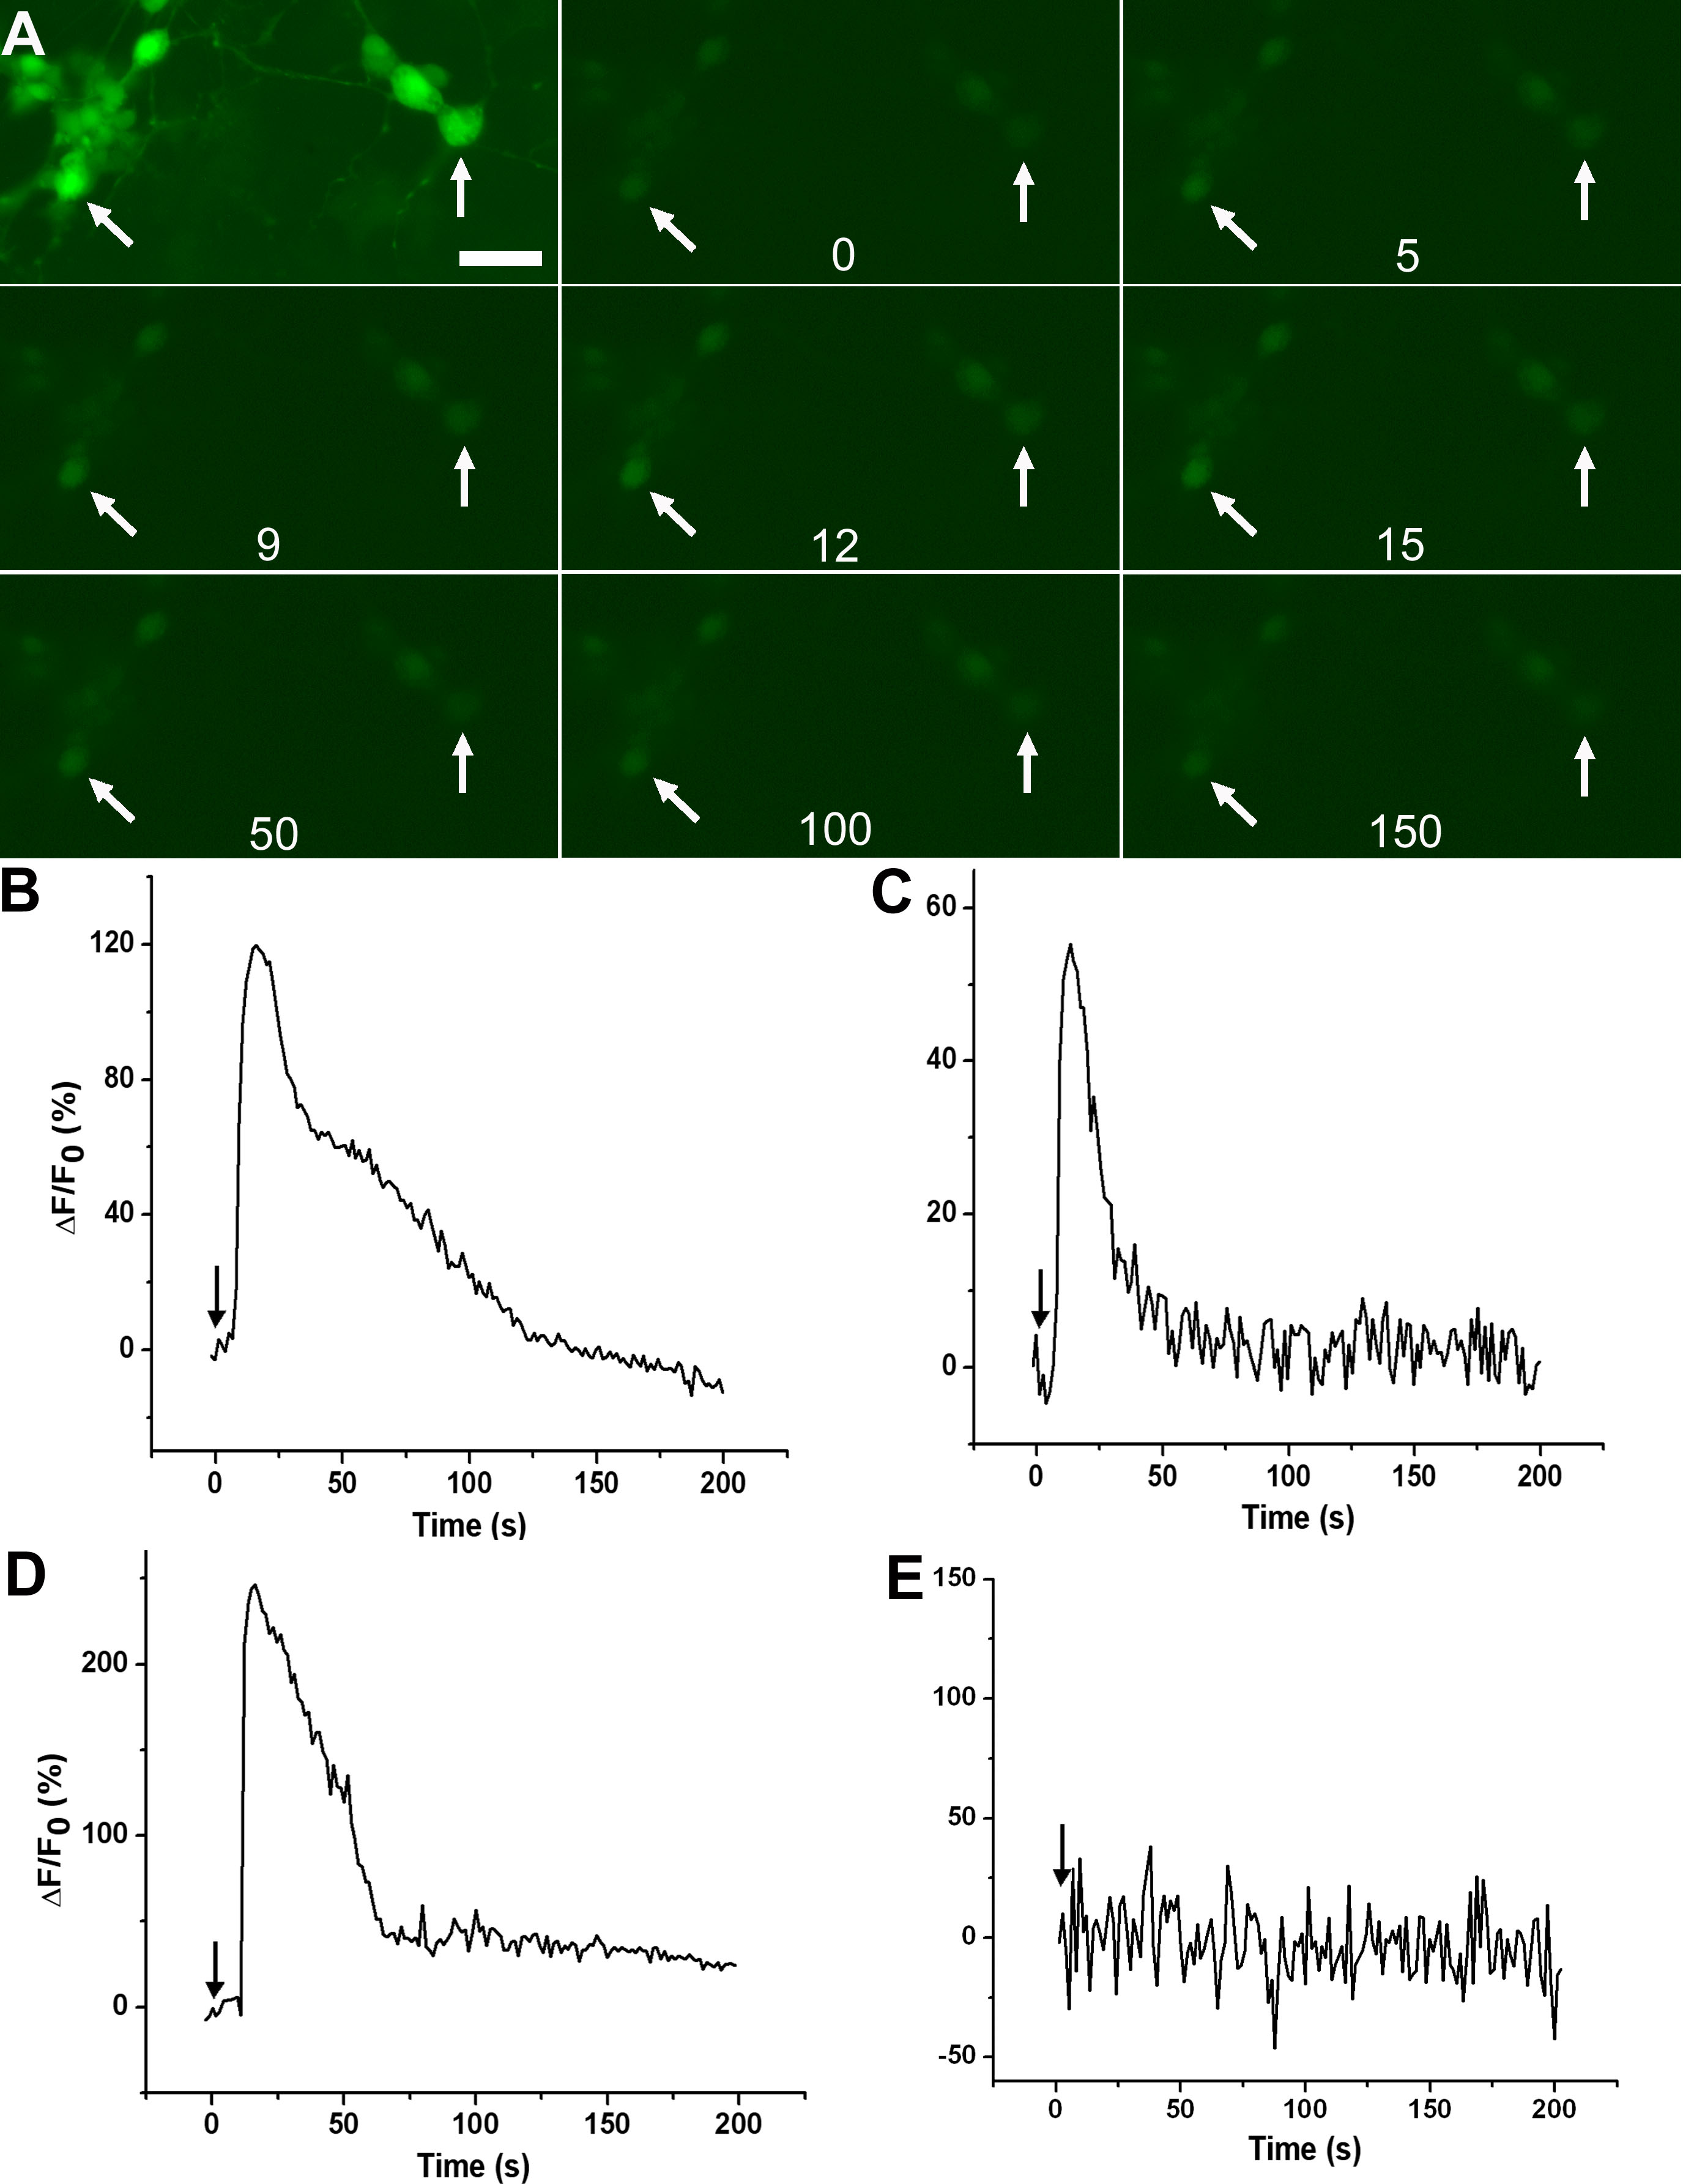
 Figure 5 of Mao, Mol Vis 2008; 14:2309-2320.