Figure 6. Effect of increasing
concentrations of TNF-α on the secretion of Complement C3 by ARPE-19
cells. Cells were treated with increasing concentrations of TNF-α
ranging from 0 to 20 ng/ml for 24 h in serum-free media. Spent media
were collected, and the levels of each protein were evaluated by
western blot analysis. Panel A shows western blot against
complement C3; both C3-α and C3-β subunits are detected. Panel B
shows western blot against cytosolic IκB-α revealing activation of
NF-κB signaling pathway. C: western blot against vinculin, a
housekeeping protein whose level remained unchanged following TNF-α
treatment. Panel D shows bar graphs of the relative expression
of complement C3 to vinculin expression in function of different TNF-α
concentration. Standard deviations were obtained from 3 replicate
experiments with p-values <0.05.
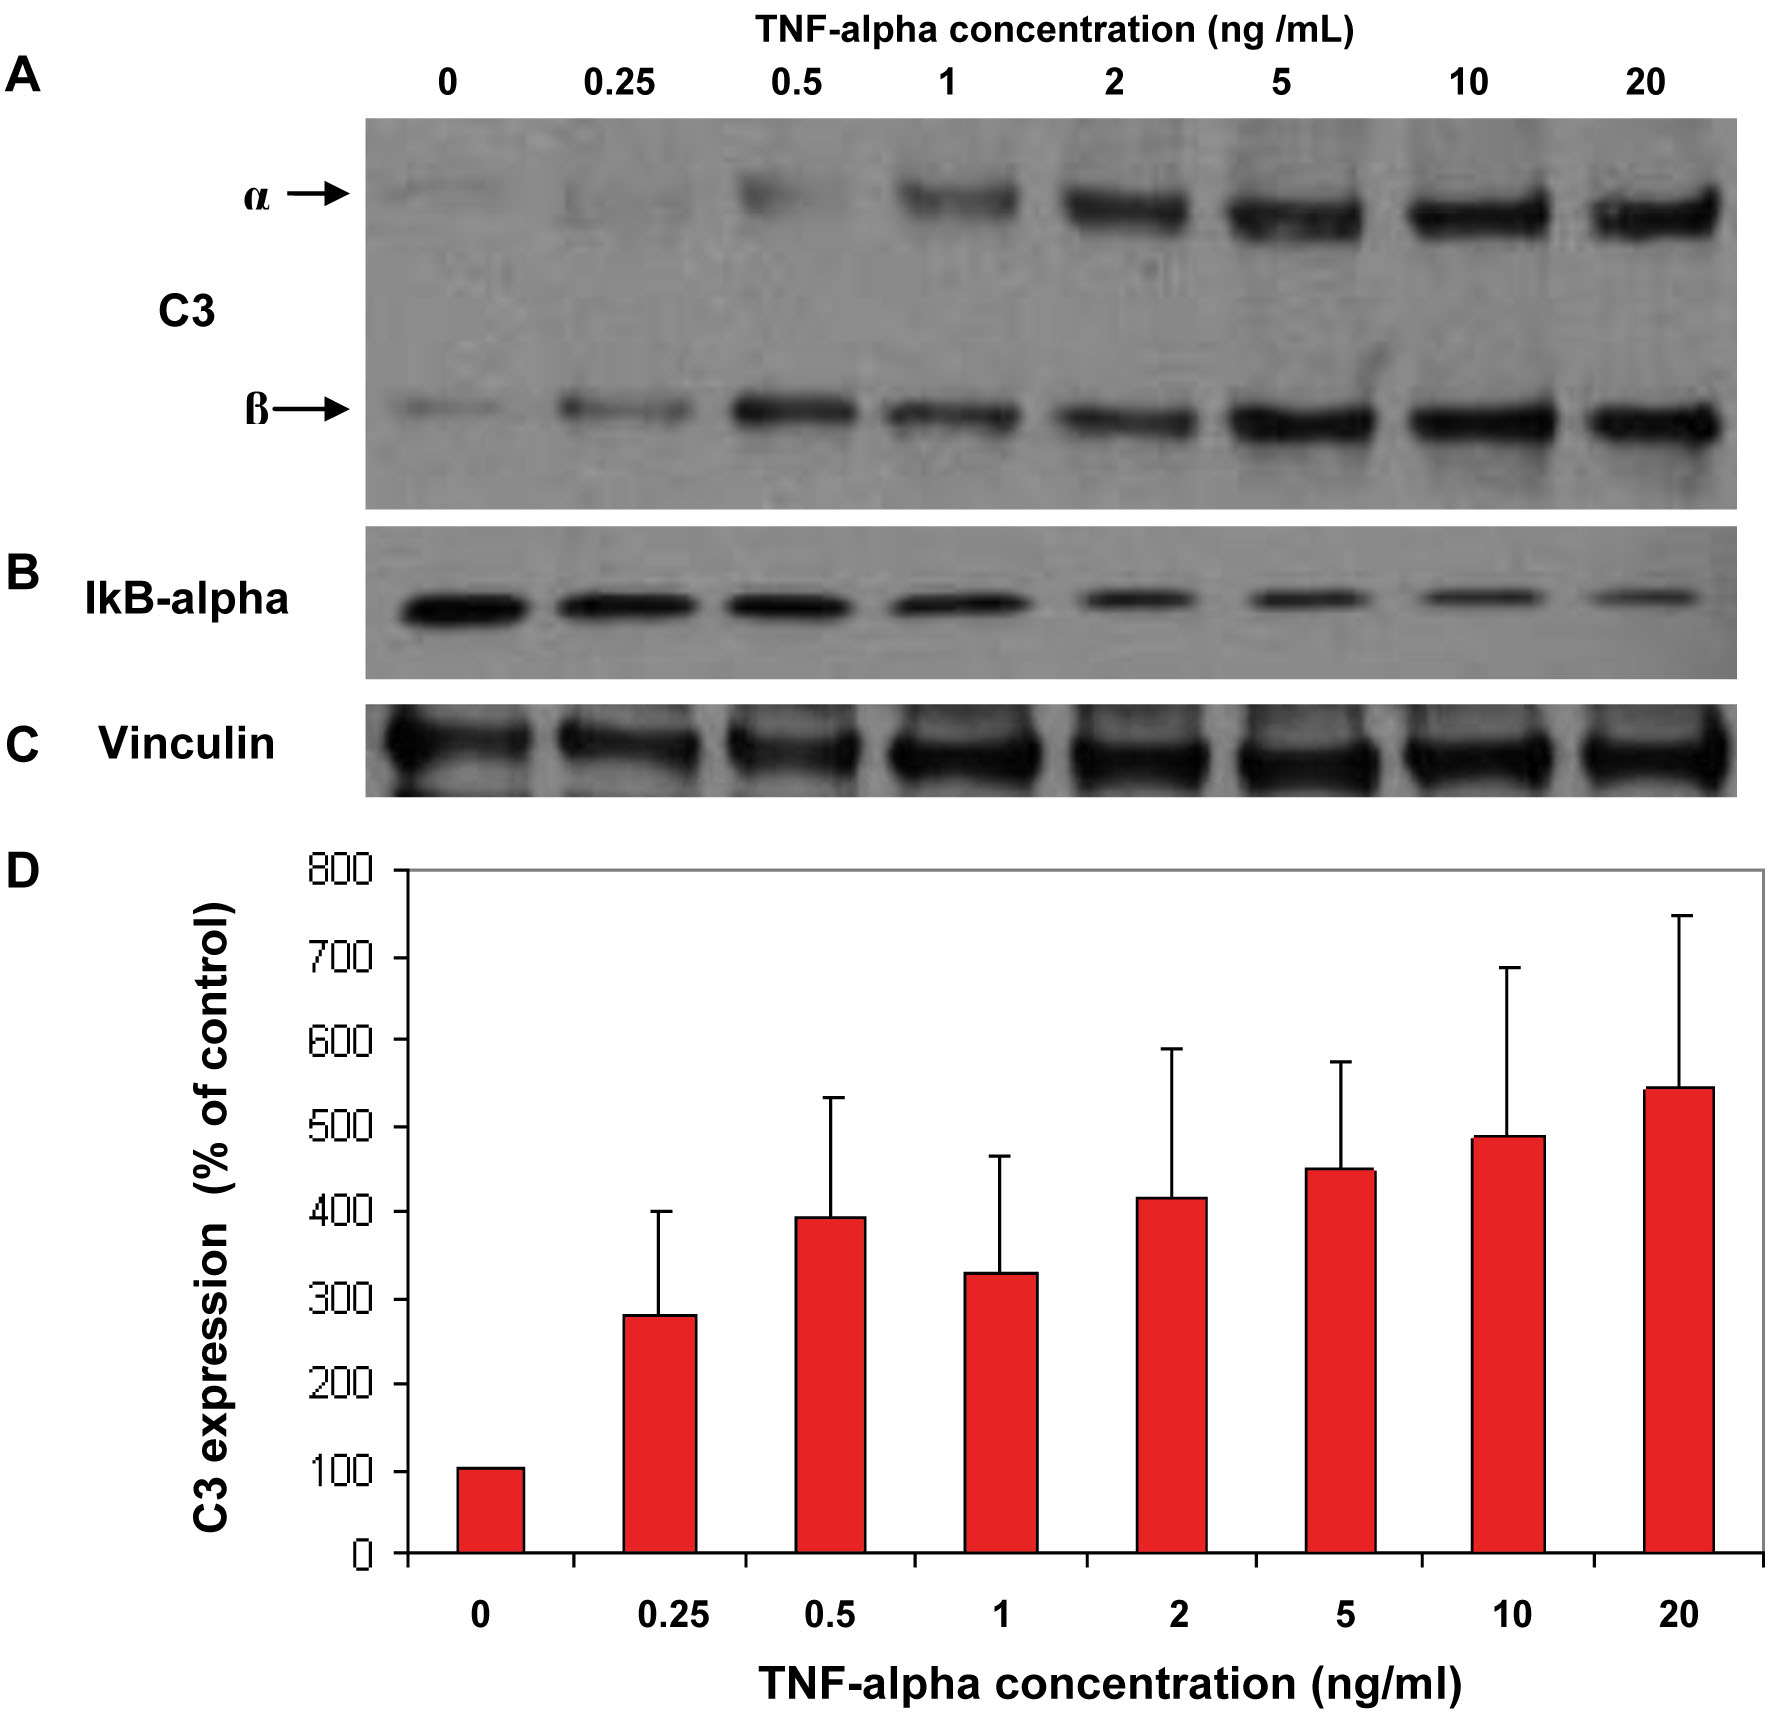
 Figure 6 of An, Mol Vis 2008; 14:2292-2303.