Figure 5. Bar graph for the 6 proteins
whose secretion was found differentially altered in TNF-α-treated
ARPE-19 cells. Blue bars indicate ratios in control versus control
cells (both labeled and unlabeled cells were untreated). Purple bars
indicate ratios in TNF-α-treated cells versus untreated cells and in
this case SILAC labeled cells were treated with TNF-α while unlabeled
cells were kept untreated. Yellow bars indicate ratios in TNF-α-treated
cells versus untreated cells and in this case unlabeled cells were
treated with TNF-α while SILAC-labeled cells were kept untreated.
Numbers inside of bars represent the total MS scans of labeled and
unlabeled peptide pairs detected for each protein. The error bars
represent the standard deviation between ratios of these individual
scans. The p-values were obtained using three pair-wise t-tests
(Sidak method) where all ratios for a given protein in control versus
control were compared to ratios obtained in TNF-α treated versus
untreated cells in both the reverse and forward experiments and these
values are as follow (* represents p-value less than 1.00E-05, and **
represents p-value less than 0.001).
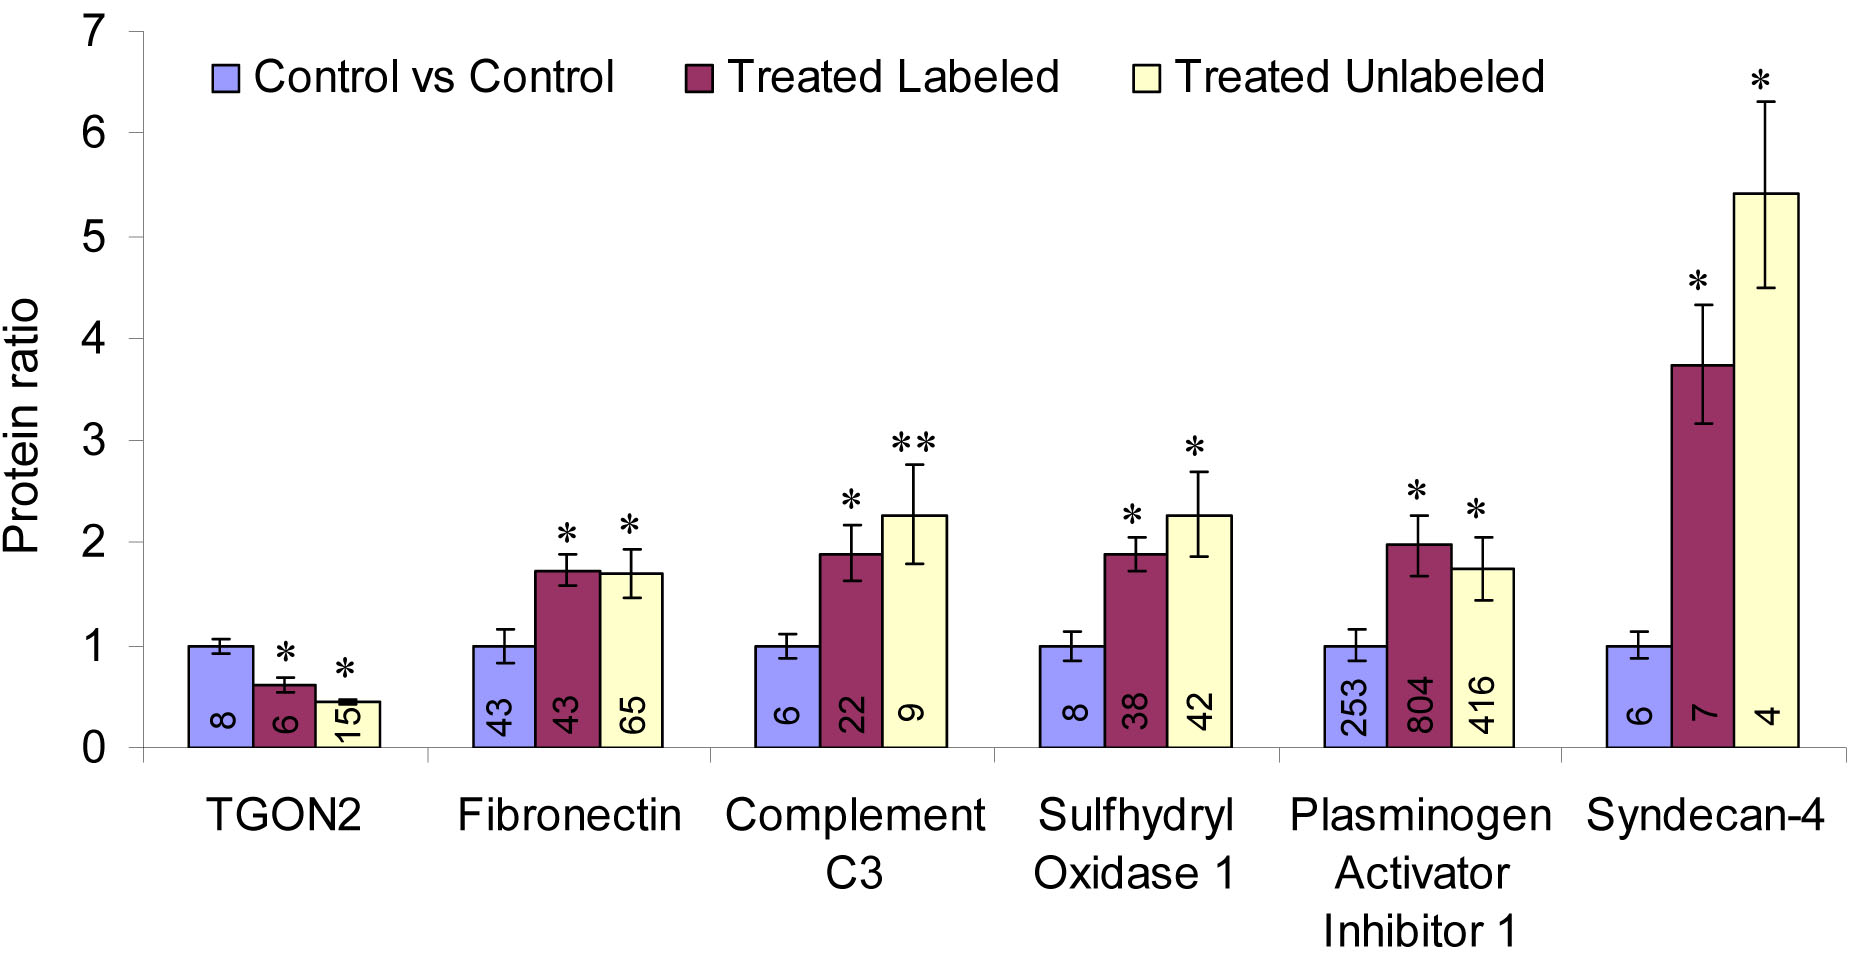
 Figure 5 of An, Mol Vis 2008; 14:2292-2303.