Figure 4. Zoom scan mass spectra of
labeled and unlabeled peptide pairs detected for complement C3 and
syndecan-4 proteins. Panels A and D show the mass
spectra and the relative intensity of labeled and unlabeled peptide
pairs detected for complement C3 (A) and for syndecan-4 (D)
in TNF-α-treated ARPE-19 cells versus untreated cells. In this case
labeled cells were treated with TNF-α (+TNF-α) while unlabeled cells
remained untreated (-TNF-α). Panels B and E show the
mass spectra obtained for these same set of peptides in the reverse
experiment where unlabeled cells were treated with TNF-α (+TNF-α) while
labeled cells remained untreated (-TNF-α). Panel C shows the
tandem mass spectrum and the fragment ions obtained for the
doubly-charged ion m/z=645.2 and confirming the peptide sequence
[SGSDEVQVGQQR] of complement C3 protein. Panel F shows the
tandem mass spectrum and the fragment ions obtained for the
doubly-charged ions m/z=579.3 and confirming the peptide sequence
[AGSGSQVPTEPK] of syndecan-4 protein.
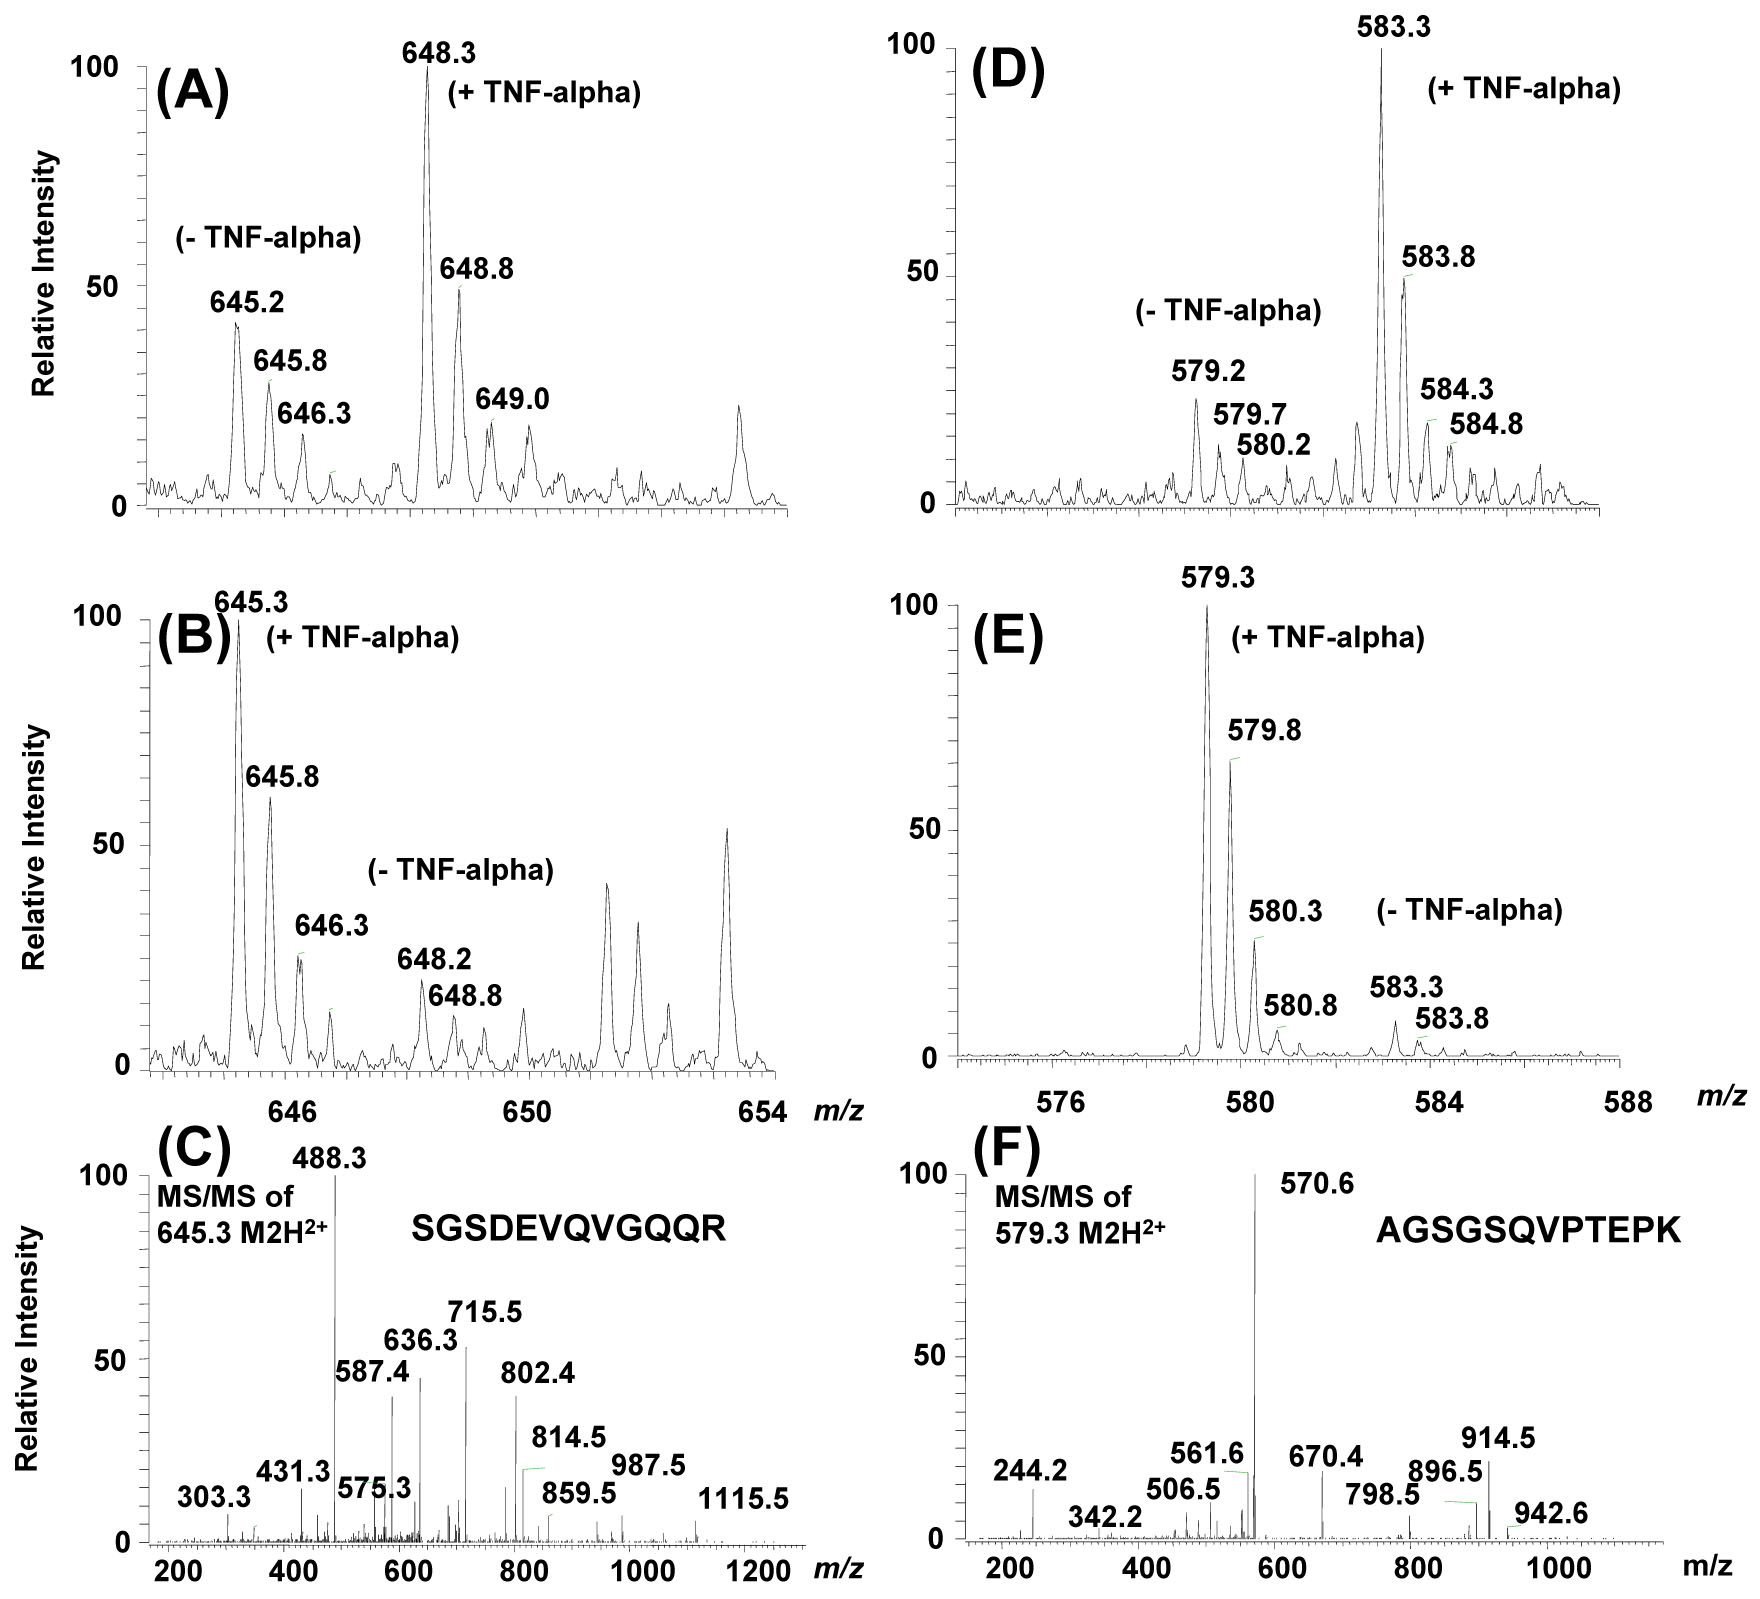
 Figure 4 of An, Mol Vis 2008; 14:2292-2303.