Figure 3. Cellular localization of
proteins identified in spent medium of ARPE-19 cells. Panel A
shows a pie chart depicting the subcellular distribution of the
proteins identified in the spent medium of ARPE-19 cells. Panel B
shows a bar graph plot representing the abundance of each class of
proteins based on the spectral count of the total peptides detected.
Other class of proteins with no known subcellular localization and no
known function was annotated as (N/A) meaning not assigned.
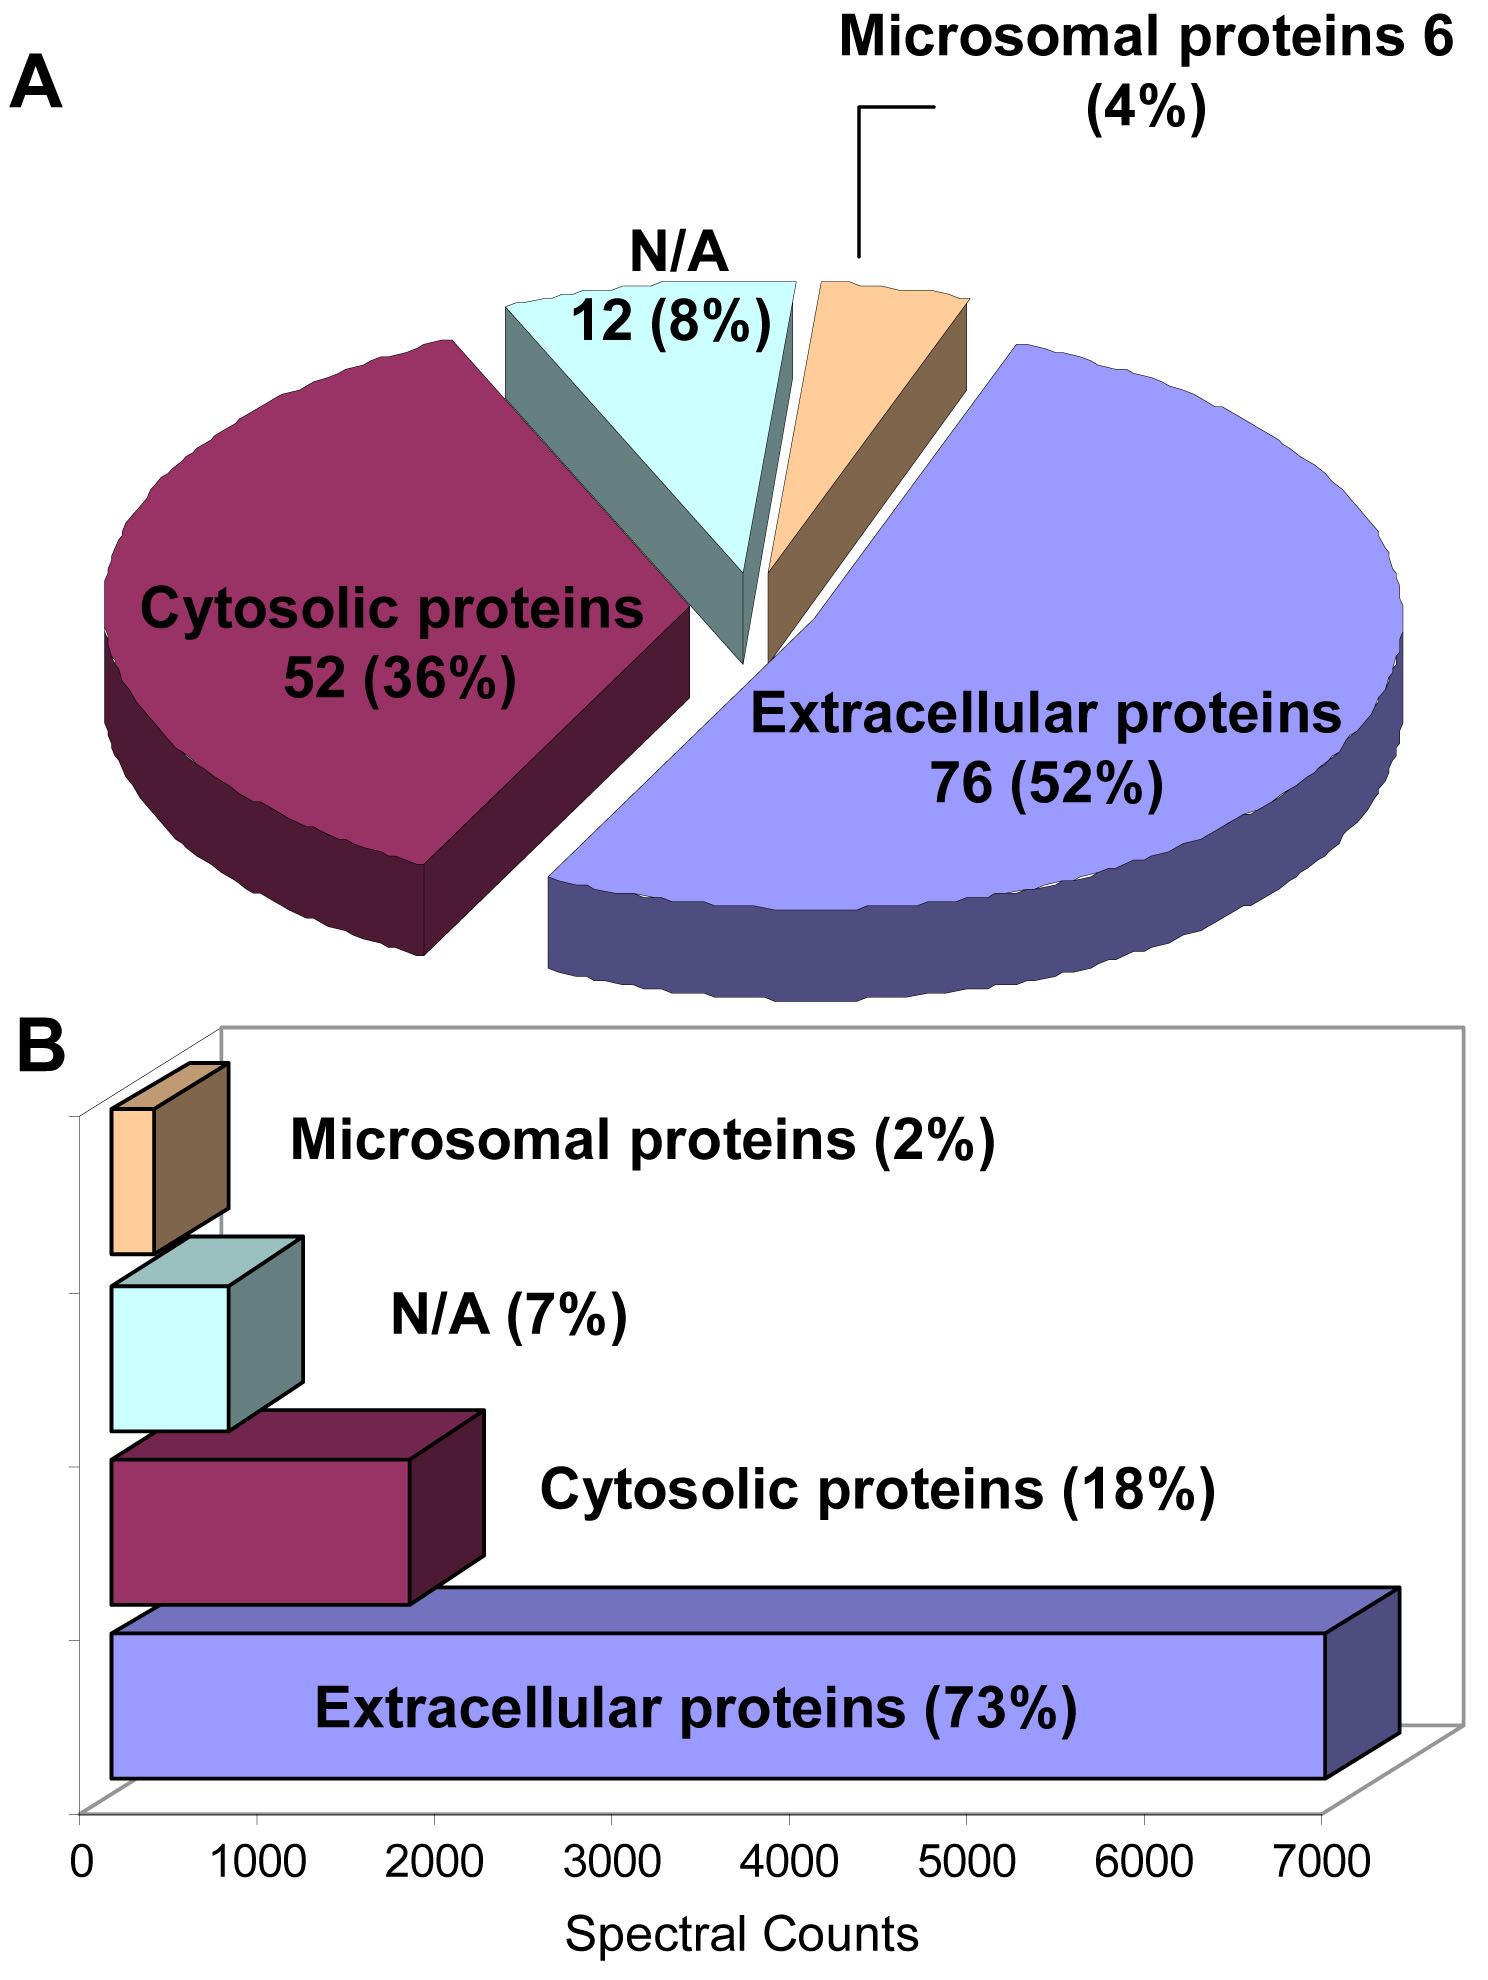
 Figure 3 of An, Mol Vis 2008; 14:2292-2303.