Figure 2. Cell viability in function of
increased TNF-α concentration. Both viable and dead cells were counted
using a hemocytometer. A percent of viable cells to the total cells was
then calculated for each culture flask. Error bars represent standard
deviations obtained from triplicate experiment for each dose of TNF-α
used. To assess the number of cell death in the control group we have
chosen not to normalize the values to 0 ng/ml of TNF-α.
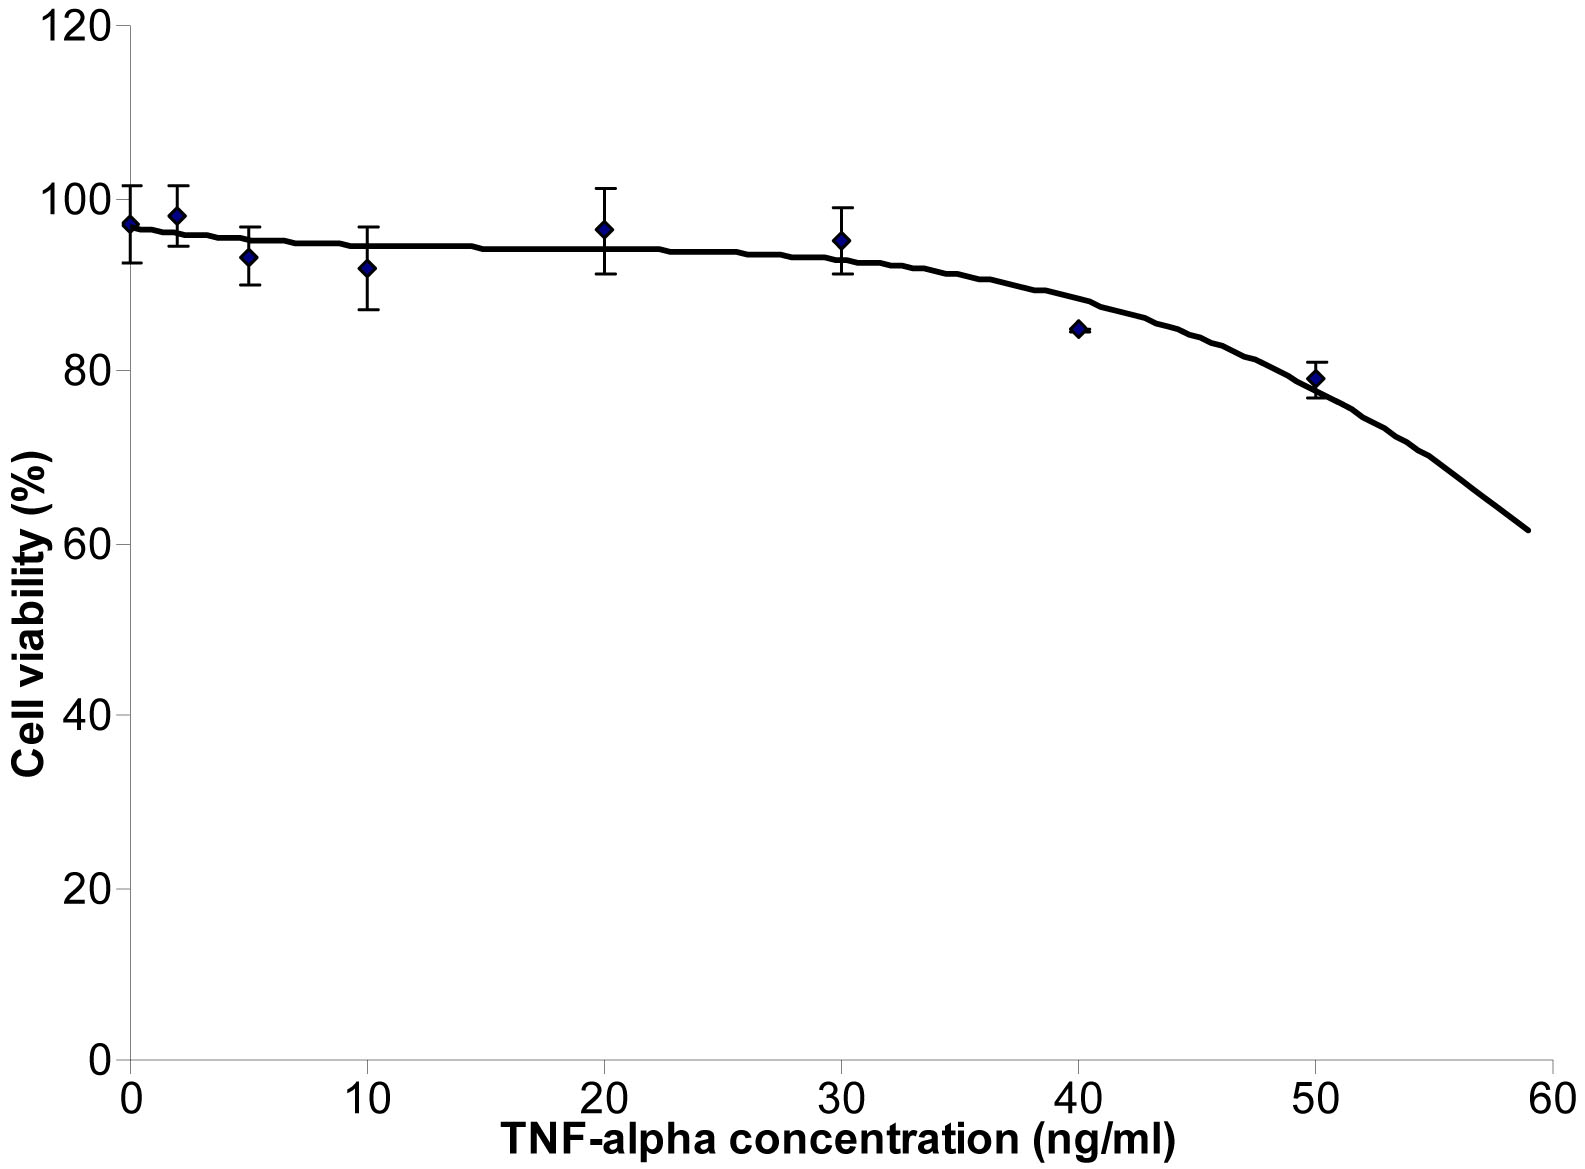
 Figure 2 of An, Mol Vis 2008; 14:2292-2303.