Figure 2. Lens opacity of all groups on difference experimental periods. All of the diabetic rats developed cataracts more or less at
the same rate. The lens progressed rapidly to opacity from the 6th week to 10th weeks after STZ injection. Values are expressed
as medians. The “+” represents the middle of that median. Median representation: 0, clear; 1, clear nucleus with wide sutures;
2, slight dense nucleus with opacities radiating from sutures; 3, dense nucleus without clefts; 4, dense nucleus with clefts;
5, nuclear cataract with clefts; 6, nuclear cataract with dense radial opacities; 7, nuclear cataract with whole lens opacity.
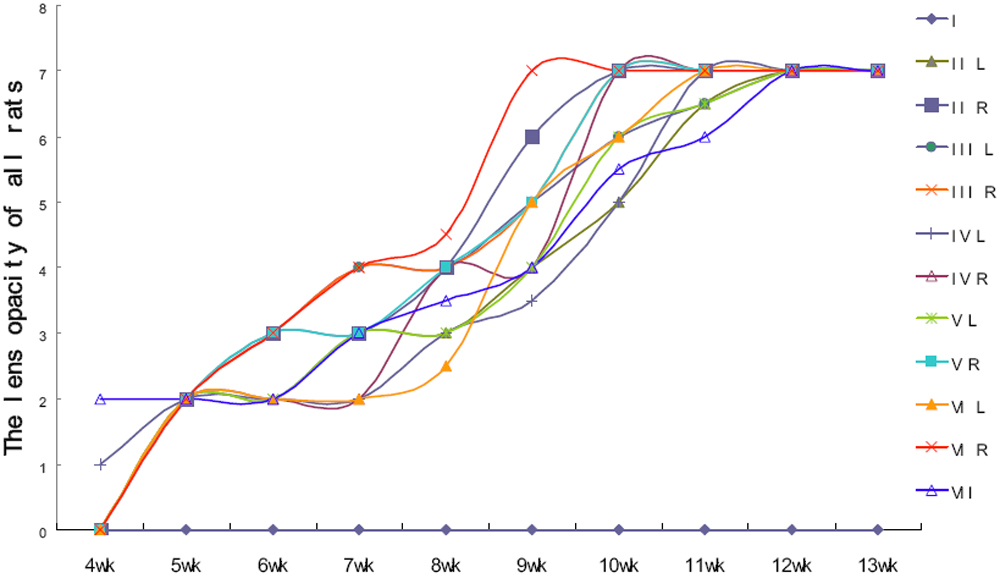
 Figure 2 of
Yan, Mol Vis 2008; 14:2282-2291.
Figure 2 of
Yan, Mol Vis 2008; 14:2282-2291.