Figure 1. Relative expression levels of HTRA1 in NVAMD patients and unaffected controls. A: Shown are expression levels in white blood cells according to rs11200638 genotypes in individuals homozygous for the wild-type
allele (GG, n=13), participants homozygous for the risk allele (AA, n=6), and in heterozygous participants (AG, n=8). Differences
between the three groups were not significant (p>0.1 for each comparison). B: Shown are mRNA levels of HTRA1 in 22 NVAMD patients and 5 unaffected individuals (p=0.9). In both A and B, RQ represents relative HTRA1 mRNA levels. Error bars represent standard deviation (SD).
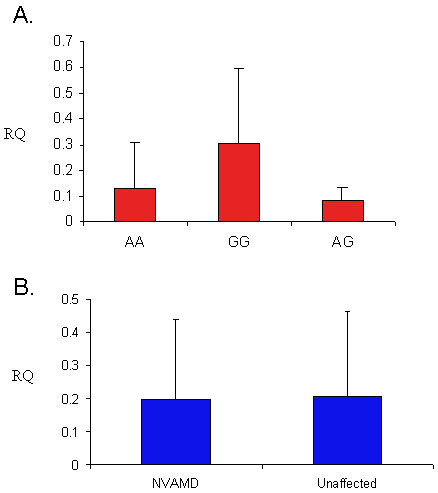
 Figure 1 of
Chowers, Mol Vis 2008; 14:2263-2271.
Figure 1 of
Chowers, Mol Vis 2008; 14:2263-2271.