Figure 8. Comparison of quantitative RT–PCR and hybridization to the microarray for claudins and ZO-3. Total RNA was extracted from
RPE that was isolated from E7 or E14 embryos and cultured with SF2 in the basal medium chamber and either SF3 or rcSF3 in
the apical medium chamber. In each reaction, 16.3 μg of total RNA was used. 18S RNA and GAPDH were used as internal controls
(not shown). For comparison, total RNA was also isolated from the RPE of E14 embryos. The effect of rcSF3 varied for the different
claudins and was influenced by the age of the RPE at the time it was isolated from the embryo. Qualitatively, the data were
similar to the data obtained by hybridization to the microarray. One notable exception was that claudin 4L2 was not detected
by the microarray in the E14 samples, but was detected by RT–PCR. Error bars indicate the standard error of 3 independent
experiments. Comparisons between SF3 and rcSF3 that were statistically significant (p<0.05) are indicated with an asterisk.
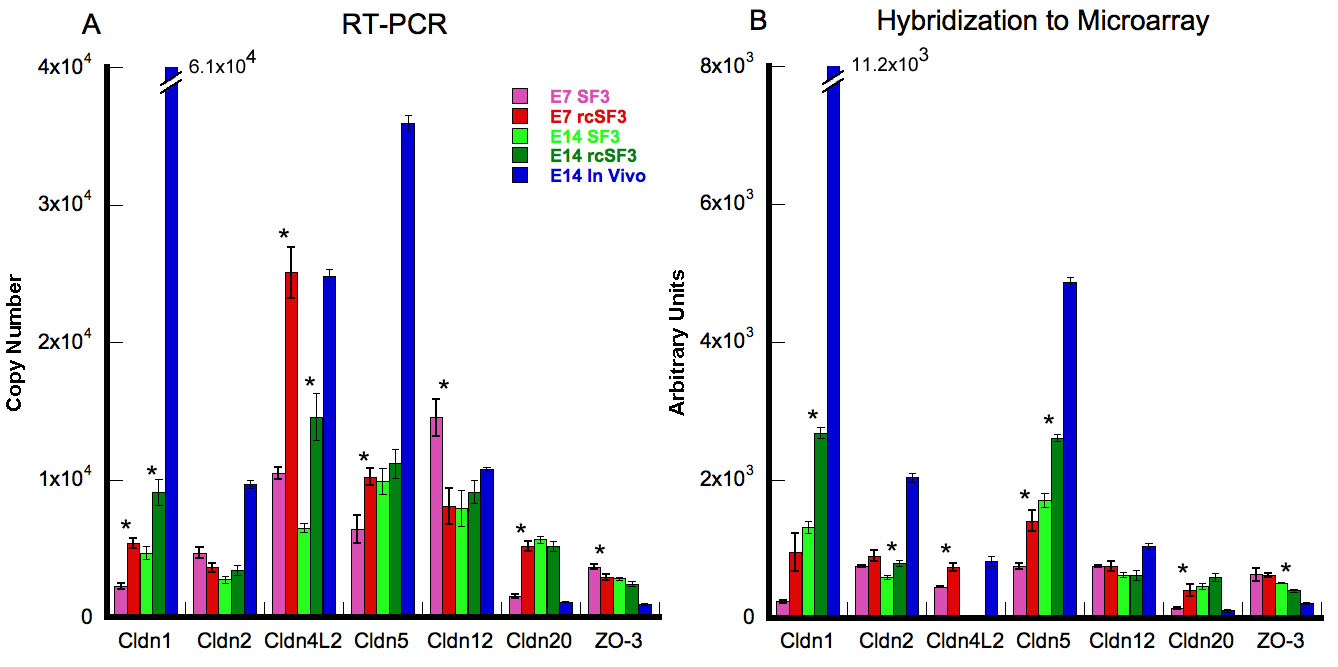
 Figure 8 of
Sun, Mol Vis 2008; 14:2237-2262.
Figure 8 of
Sun, Mol Vis 2008; 14:2237-2262.