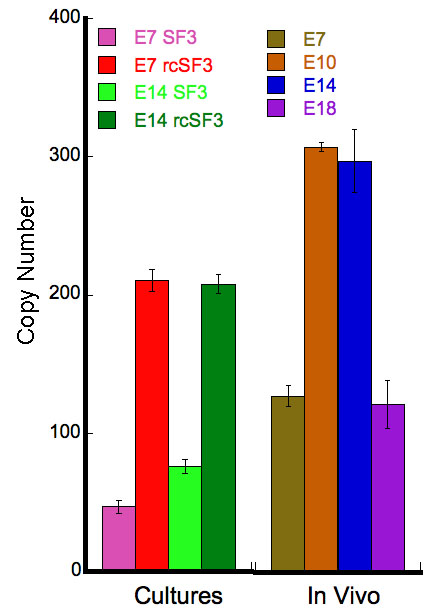
Figure 7. Expression of claudin 19 in vivo and in culture. Total RNA was extracted from native or cultured RPE. Native RPE was isolated
from E7, E10, E14, and E18 embryos. For cultured RPE, RPE isolated from E7 or E14 embryos was cultured with SF2 in the basal
medium chamber and either SF3 or rcSF3 in the apical medium chamber. In each reaction, 16.3 ng of total RNA was used. 18S
RNA and GAPDH were used as internal controls (not shown). Quantitative RT–PCR was used to amplify claudin 19 mRNA using primer
set 1 from
Table 1. Similar results were obtained with primer set 2 (not shown). The level of expression on E18 was similar to the level found
in E7 RPE, when few tight junctional strands are evident. Consistent with the peak of expression on E14, rcSF3 induced the
expression of claudin 19 in E7 and E14 cultures. Error bars indicate the standard error of 3 independent experiments. The
differences between SF3 and rcSF3 cultures were statistically significant (p<0.001). The differences between E7 or E18 RPE
and E10 or E14 RPE were statistically significant (p<0.001).
 Figure 7 of
Sun, Mol Vis 2008; 14:2237-2262.
Figure 7 of
Sun, Mol Vis 2008; 14:2237-2262.