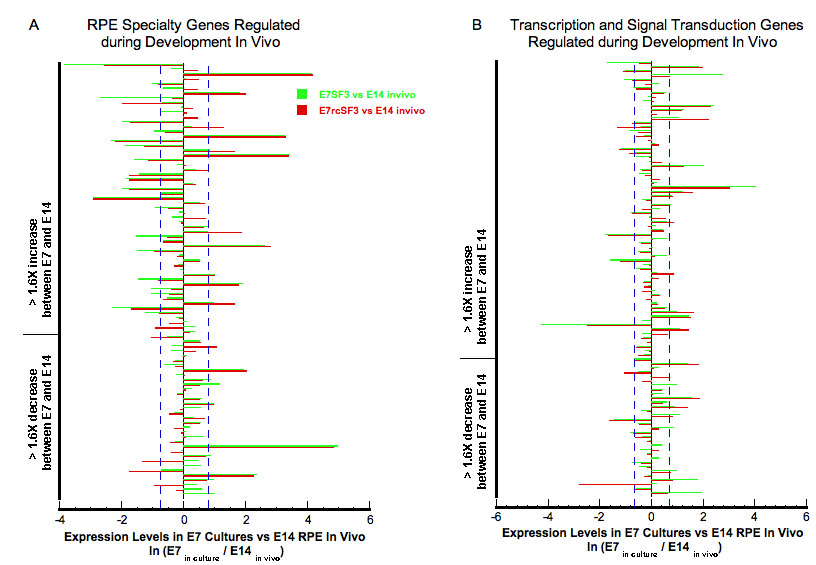
Figure 3. Effect of E14 rcSF3 on the
maturation of E7 cultures. E14 rcSF3 made gene expression in E7
cultures more like that of E14 RPE in vivo. The following select genes
were analyzed if their expression in vivo changed more than 1.6X during
development [
1]:
genes involved in the visual cycle, phagocytosis, junctional complexes,
cytoskeleton, matrix, and matrix receptors or plasma membrane transport
(
A); genes involved in the regulation of transcription or signal
transduction (
B). Each pair of green and red bars represents a
single gene. Green bars indicate expression when E7 RPE was maintained
in basal conditions (SF3); red bars indicate expression in retinal
conditioned medium (rcSF3). The bars indicate the natural logarithm of
the ratio (expression in culture)/(expression in native E14 RPE), where
0.0 indicates no difference between the E7 culture and native E14 RPE.
A natural logarithm of 0.7 (dashed blue lines) indicates a 2X deviation
of the E7 cultures from E14 RPE expression in vivo. Positive values
indicate overexpression of a gene in culture. For most genes, the green
and red bars are the same length, indicating no effect of rcSF3 on
expression. For most of the genes that were affected by rcSF3, the red
bar is shorter than the green bar, which indicates that expression
levels approached the levels observed in native E14 RPE.
 Figure 3 of Sun, Mol Vis 2008; 14:2237-2262.