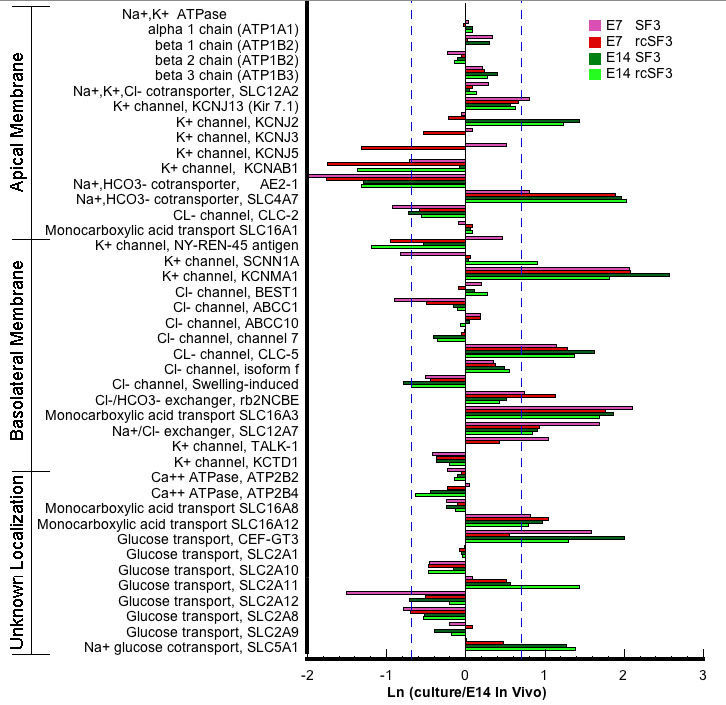
Figure 15. Effect of embryonic age and rcSF3 on genes that regulate transport across the plasma membrane. The ratio of (expression in
culture)/(expression in native E14 RPE) is expressed as a natural logarithm. The dashed lines at ±0.7 represent a 2X deviation
from expression on E14 in vivo. Complete gene descriptions and values for hybridization to the microarray are included in
Appendix 6.
 Figure 15 of
Sun, Mol Vis 2008; 14:2237-2262.
Figure 15 of
Sun, Mol Vis 2008; 14:2237-2262.