Figure 4. Scanning electron micrographs of
the outer hair cells from the middle cochlear turn of A: P2 Cdh23v-6J
heterozygote (+ +/Cdh23v-6J +), B:Cdh23v-6J
+/Cdh23v-6J Pcdh15av-Jfb mouse, C:+Pcdh15av-Jfb/Cdh23v-6J
Pcdh15av-Jfb mouse, and D:Cdh23v-6J
Pcdh15av-Jfb/Cdh23v-6J Pcdh15av-Jfb
mouse. Inset shows a close-up view of a stereocilia bundle of a Cdh23v-6J
Pcdh15av-Jfb/Cdh23v-6J Pcdh15av-Jfb
mouse. Note the presence of stereocilia links. Scale bars in A-D
equal 2 μm; scale bar in inset in D equals 200 nm.
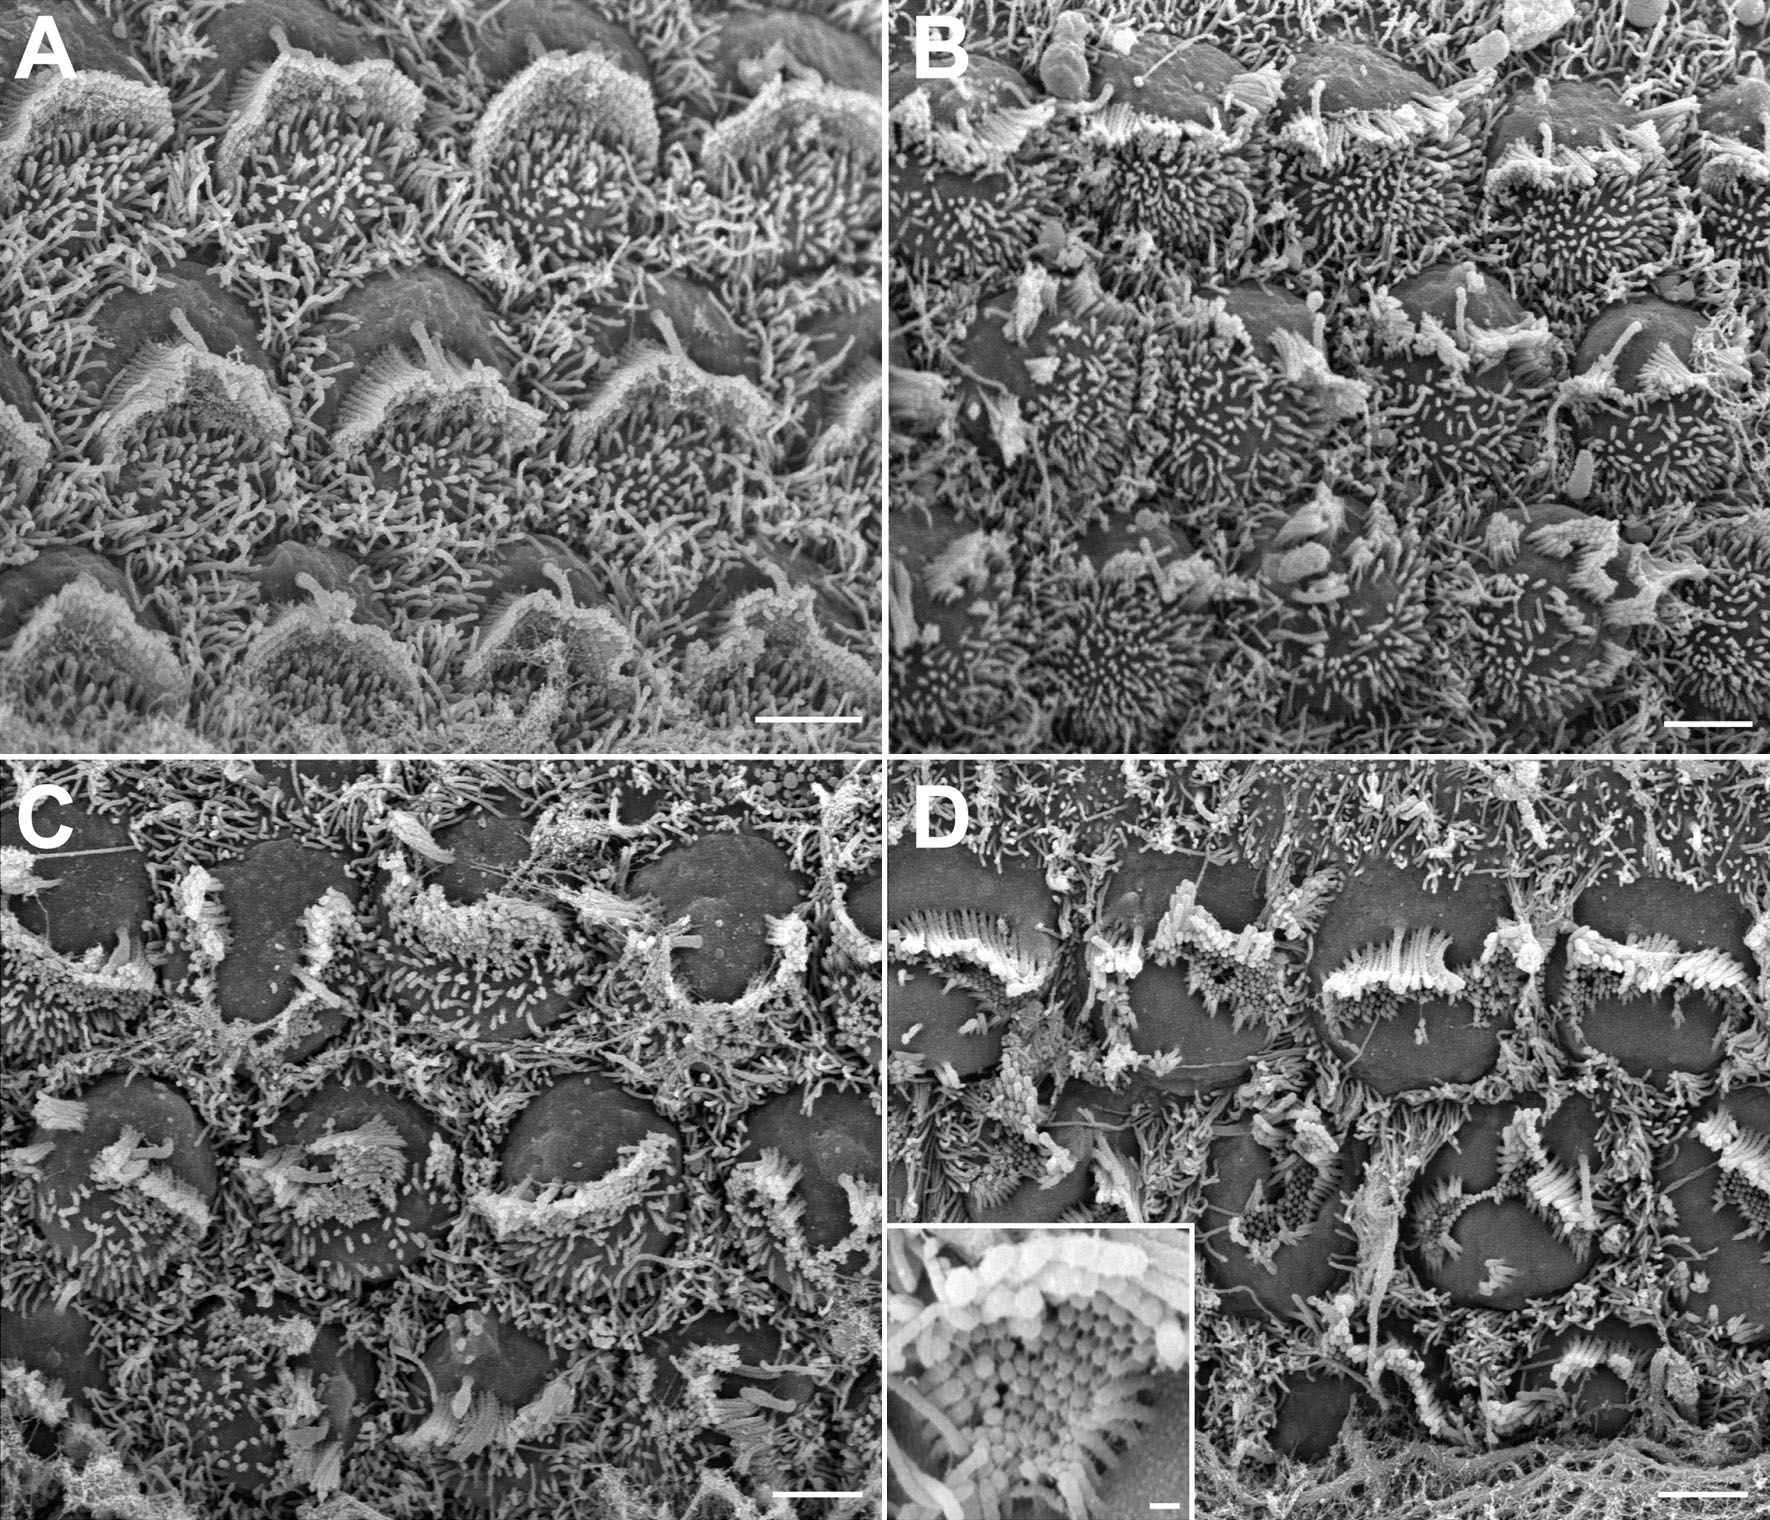
 Figure 4 of Ahmed, Mol Vis 2008; 14:2227-2236.