Figure 6. Impression cytology evaluated by flow cytometry and viewed after cytospin centrifugation. Percentages of RLA-DR- (A) and TNFR1- (C) positive cells after multiple instillations of PBS, BAK Sol, BAK Em, CKC Sol, CKC Em is displayed. The astersisk indicates
that p<0.0001 compared with PBS, BAK Em, CKC Sol, and CKC Em-instilled groups, and the doube asterisk means that p<0.05 compared
with PBS, BAK Em, CKC Sol, and CKC Em-instilled groups. Positive cells for RLA-DR (green, B) and TNFR1 (green, D) were viewed after propidium iodide staining (red) and cytospin centrifugation. The scale bar indicates 100 μm.
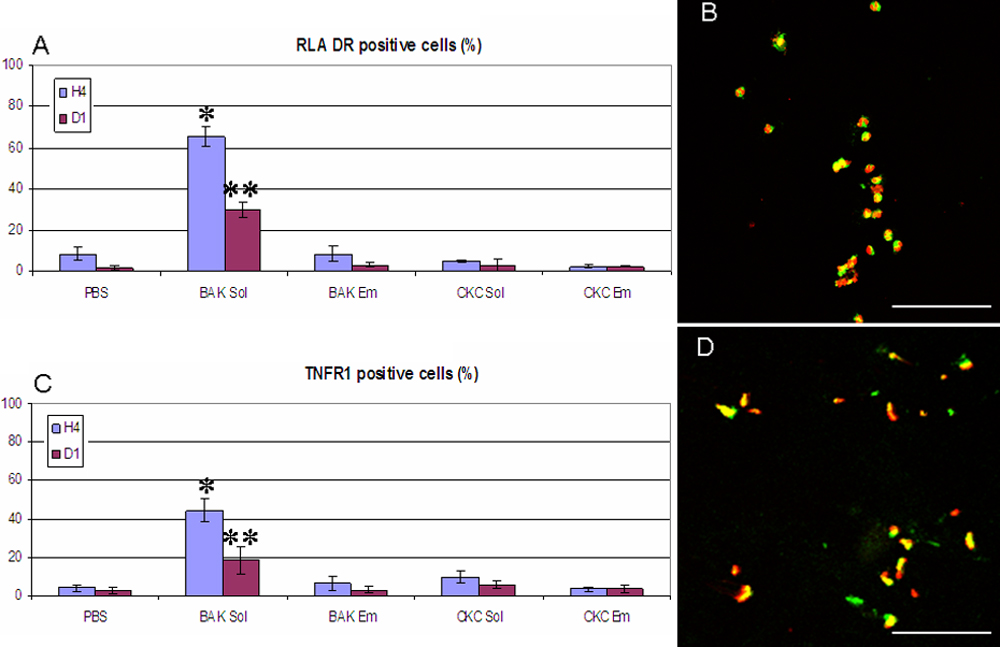
 Figure 6 of
Liang, Mol Vis 2008; 14:204-216.
Figure 6 of
Liang, Mol Vis 2008; 14:204-216.