Figure 4. In vivo confocal microscopy scores in the five tested groups. The toxicity of CKC Em was less than that of BAK Sol, BAK Em,
and CKC Sol with no significant differences with the PBS-instilled groups at all time points (H4, D1, and D4). BAK Sol presented
the highest IVCM toxic score at H4 on D1 with intermediate results for BAK Em and CKC Sol. The asterisk indicates that p<0.01
compared to PBS and CKC Em; the sharp (hash mark) denotes that p<0.05 compared to BAK Sol; and the filled diamond symbol indicates
that p<0.05 compared to CKC Sol.
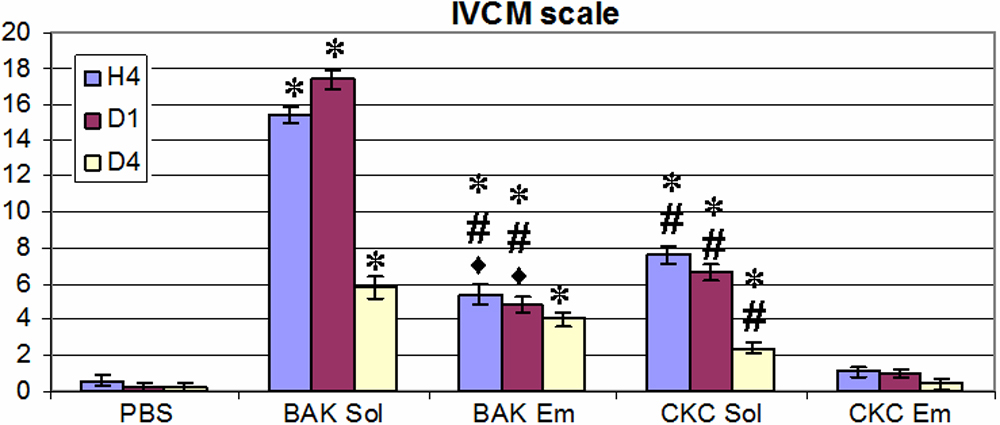
 Figure 4 of
Liang, Mol Vis 2008; 14:204-216.
Figure 4 of
Liang, Mol Vis 2008; 14:204-216.