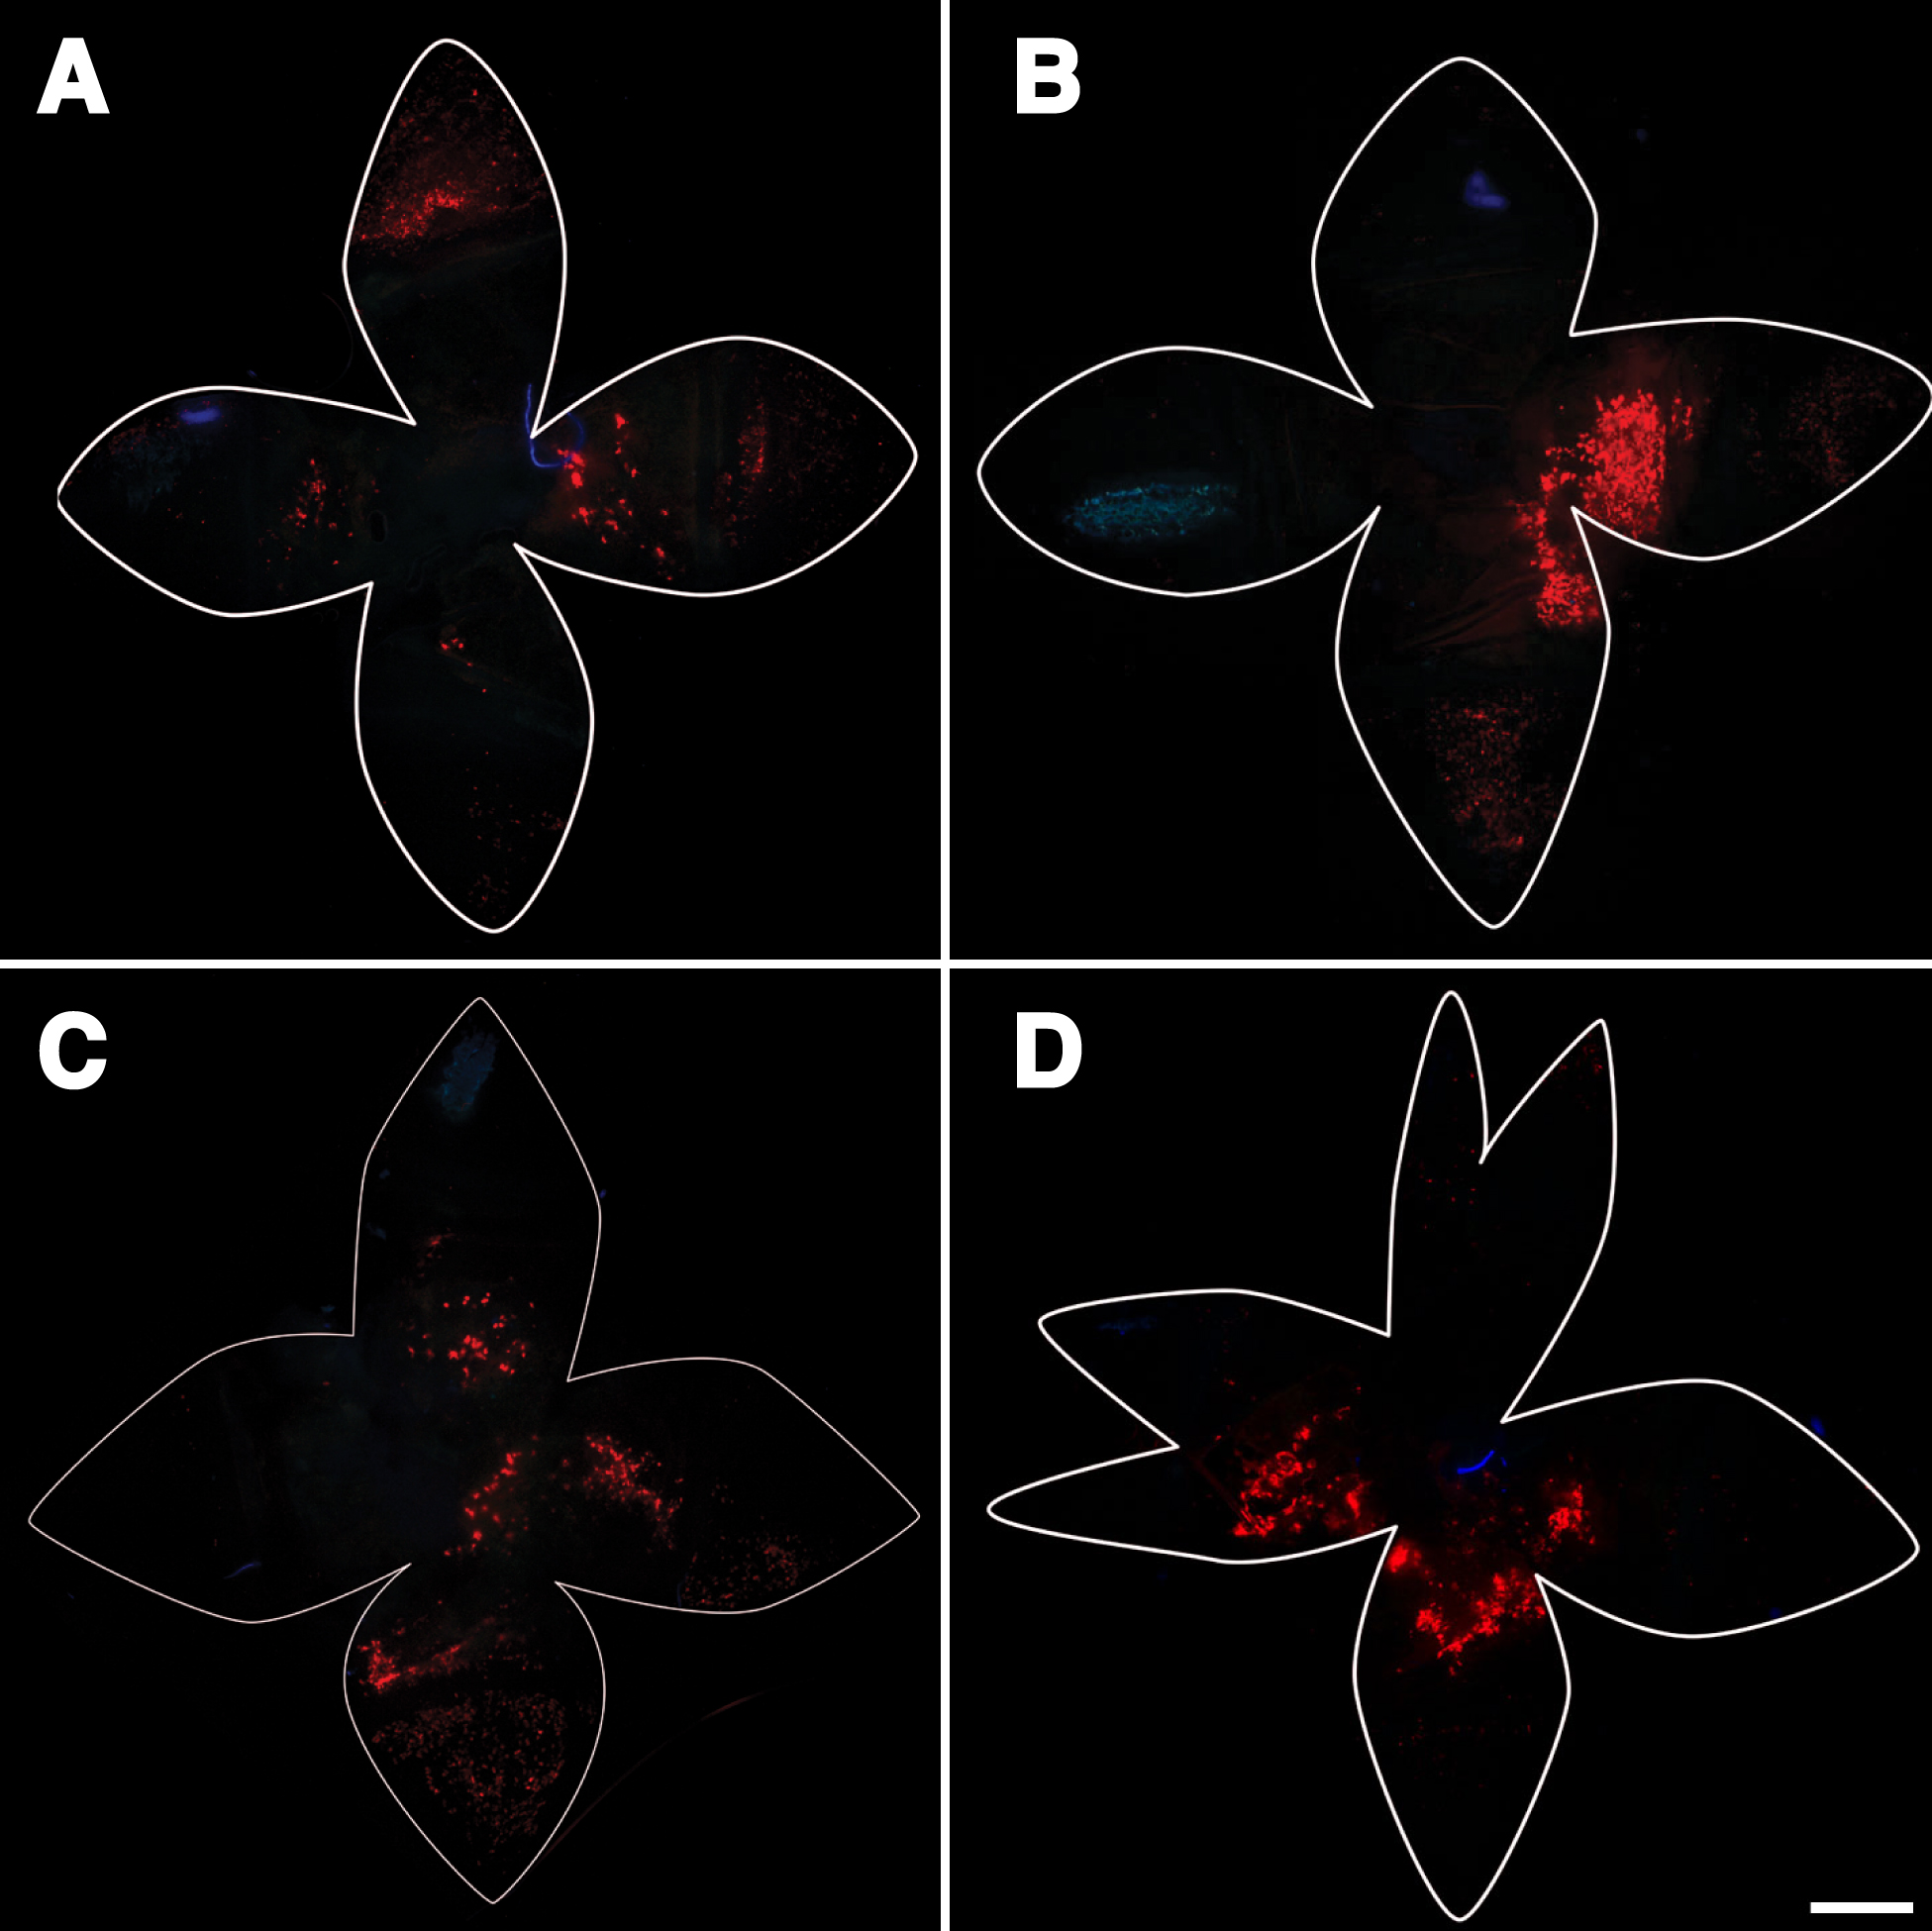
Figure 9. Subretinal injection followed by
electroporation, and analysis of flatmounts. Four different
electroporation programs were employed to compare qualitatively their
efficacy. These conditions resembled the voltage, pulse duration, and
train of four different published techniques to electroporate the
retina and RPE sheet in other species and at differing stages of
development.
A: The conditions were 30 V, 8 pulses, 50 ms
duration per pulse, and an interval of 0.1 s between pulses [
61].
B: The
conditions were 38 V, 5 pulses, 50 ms duration, and 1 s between pulses [
62].
C: The
conditions were 50 V, 5 pulses, 50 ms pulse duration, and 0.95 s
between pulses [
63].
D: The conditions included two voltage steps per cycle. The
first voltage was 150 V for 0.25 ms and then 5 V for 5 ms. This
combination of voltages was applied 5 times [
47]. In all four images, cells were transfected
and expressed tdTomato in the flatmount. In most cases, tdTomato
accumulated in cells of the cornea, ciliary body, and to a somewhat
lesser extent in the RPE. In
A,
B, and
C, there
is evidence of red fluorescence in the corneal endothelium. Some of the
expression was off center from the position of the anode. In one case
there was some evidence of burn damage. The scale bar represents 1 mm.
 Figure 9 of Johnson, Mol Vis 2008; 14:2211-2226.