Figure 10. Subretinal injection followed
by electroporation at different voltages. In all panels 1 μl 2 mg/ml
pVAX-tdTomato in water were injected and three blebs were raised. Five
different voltage settings (0, 25, 40, 70, and 100 V) were used.
Electroporation followed with a constant 1 ms pulse, 1 s interval, and
5 pulses on panels A, C, E, G, and I,
and 10 pulses with panels B, D, F, H,
and J. In A and B the samples received 0 V, in C
and D, 25 V, in E and F, 40 V, in G and
H, 70 V, and in I and J, 100 V. Each panel
represents a flatmount of the eye excluding the lens. The tips of the
florets correspond to the center of the cornea, and the central area
from the midpoint or greatest bulge of each petal inwards corresponds
to the RPE sheet. The red fluorescence is punctate; each dot
corresponds to a single RPE cell. When no voltage was applied, there
was no evidence of tdTomato expression (red). When 25 V was applied,
there was no expression of tdTomato; however, when 40 to 100 V were
applied, there was an accumulation of tdTomato fluorescence. The scale
bar represents 1 mm.
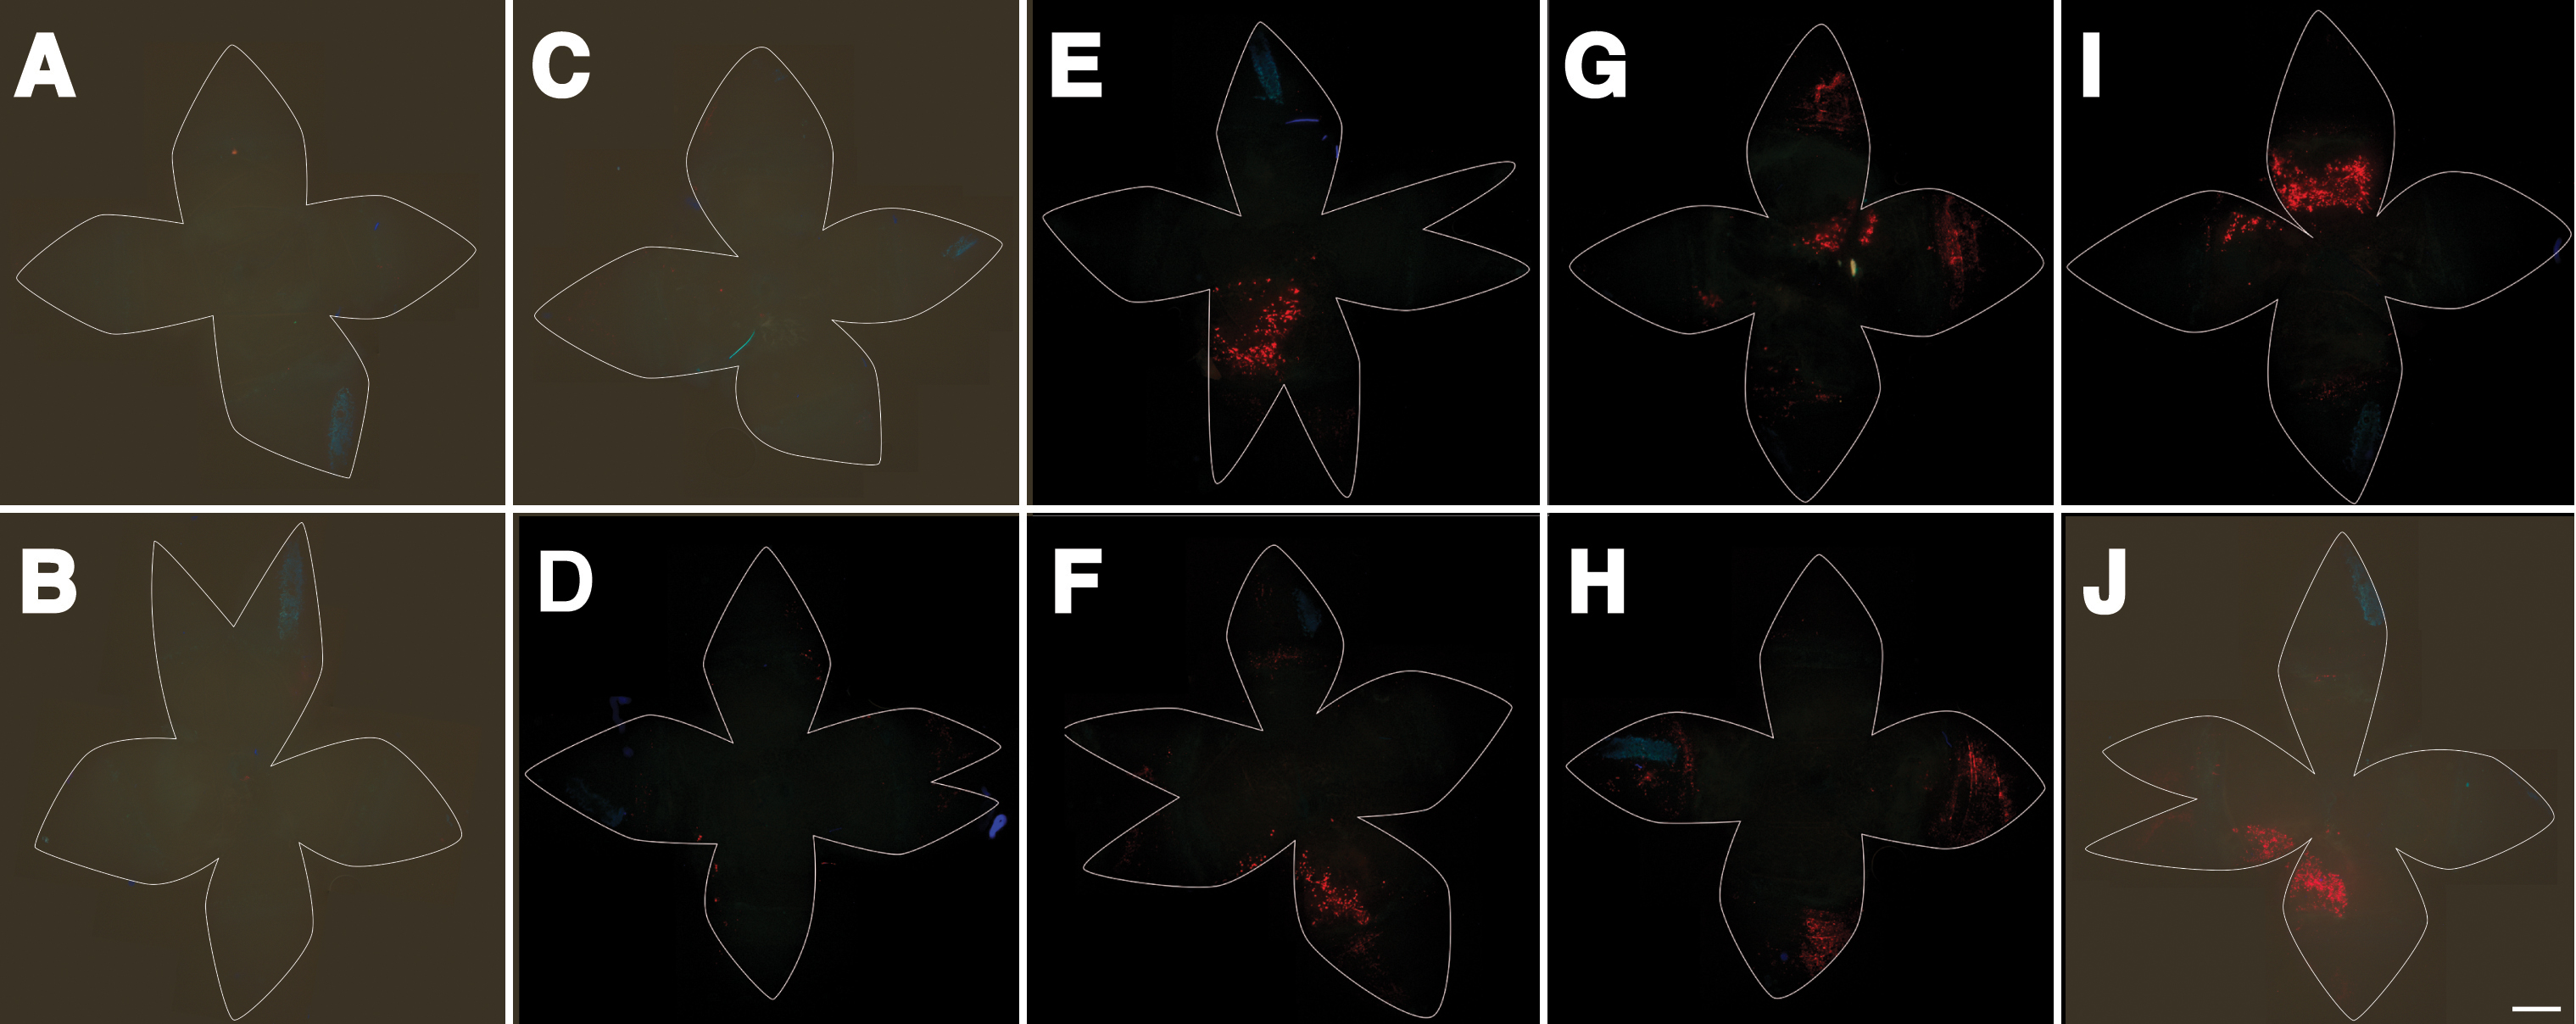
 Figure 10 of Johnson, Mol Vis 2008; 14:2211-2226.