Figure 4. Retinal and optic nerve findings
at various intervals after rAION induction. A: Control optic
nerve from Thy1-CFP transgenic mouse; no axonal loss is detected. B:
Histologicial section of the optic nerve at 21 days after rAION
induction; arrows point to moderate axonal loss (maximal, 25%). C:
Flat-mounted retina from control (untreated) eye of same mouse showing
normal density of RGC nuclei. D. Flat-mounted retina from study
eye showing RGC loss, as compared to control (C). E:
Histological section of control (untreated) optic nerve from CNPase-GFP
transgenic mouse. Note the complete myelinization and number of
oligodendrocyte nuclei. F: Twenty-one days after rAION
induction, maximal (20%–30%) oligodendrocyte loss is demonstrated.
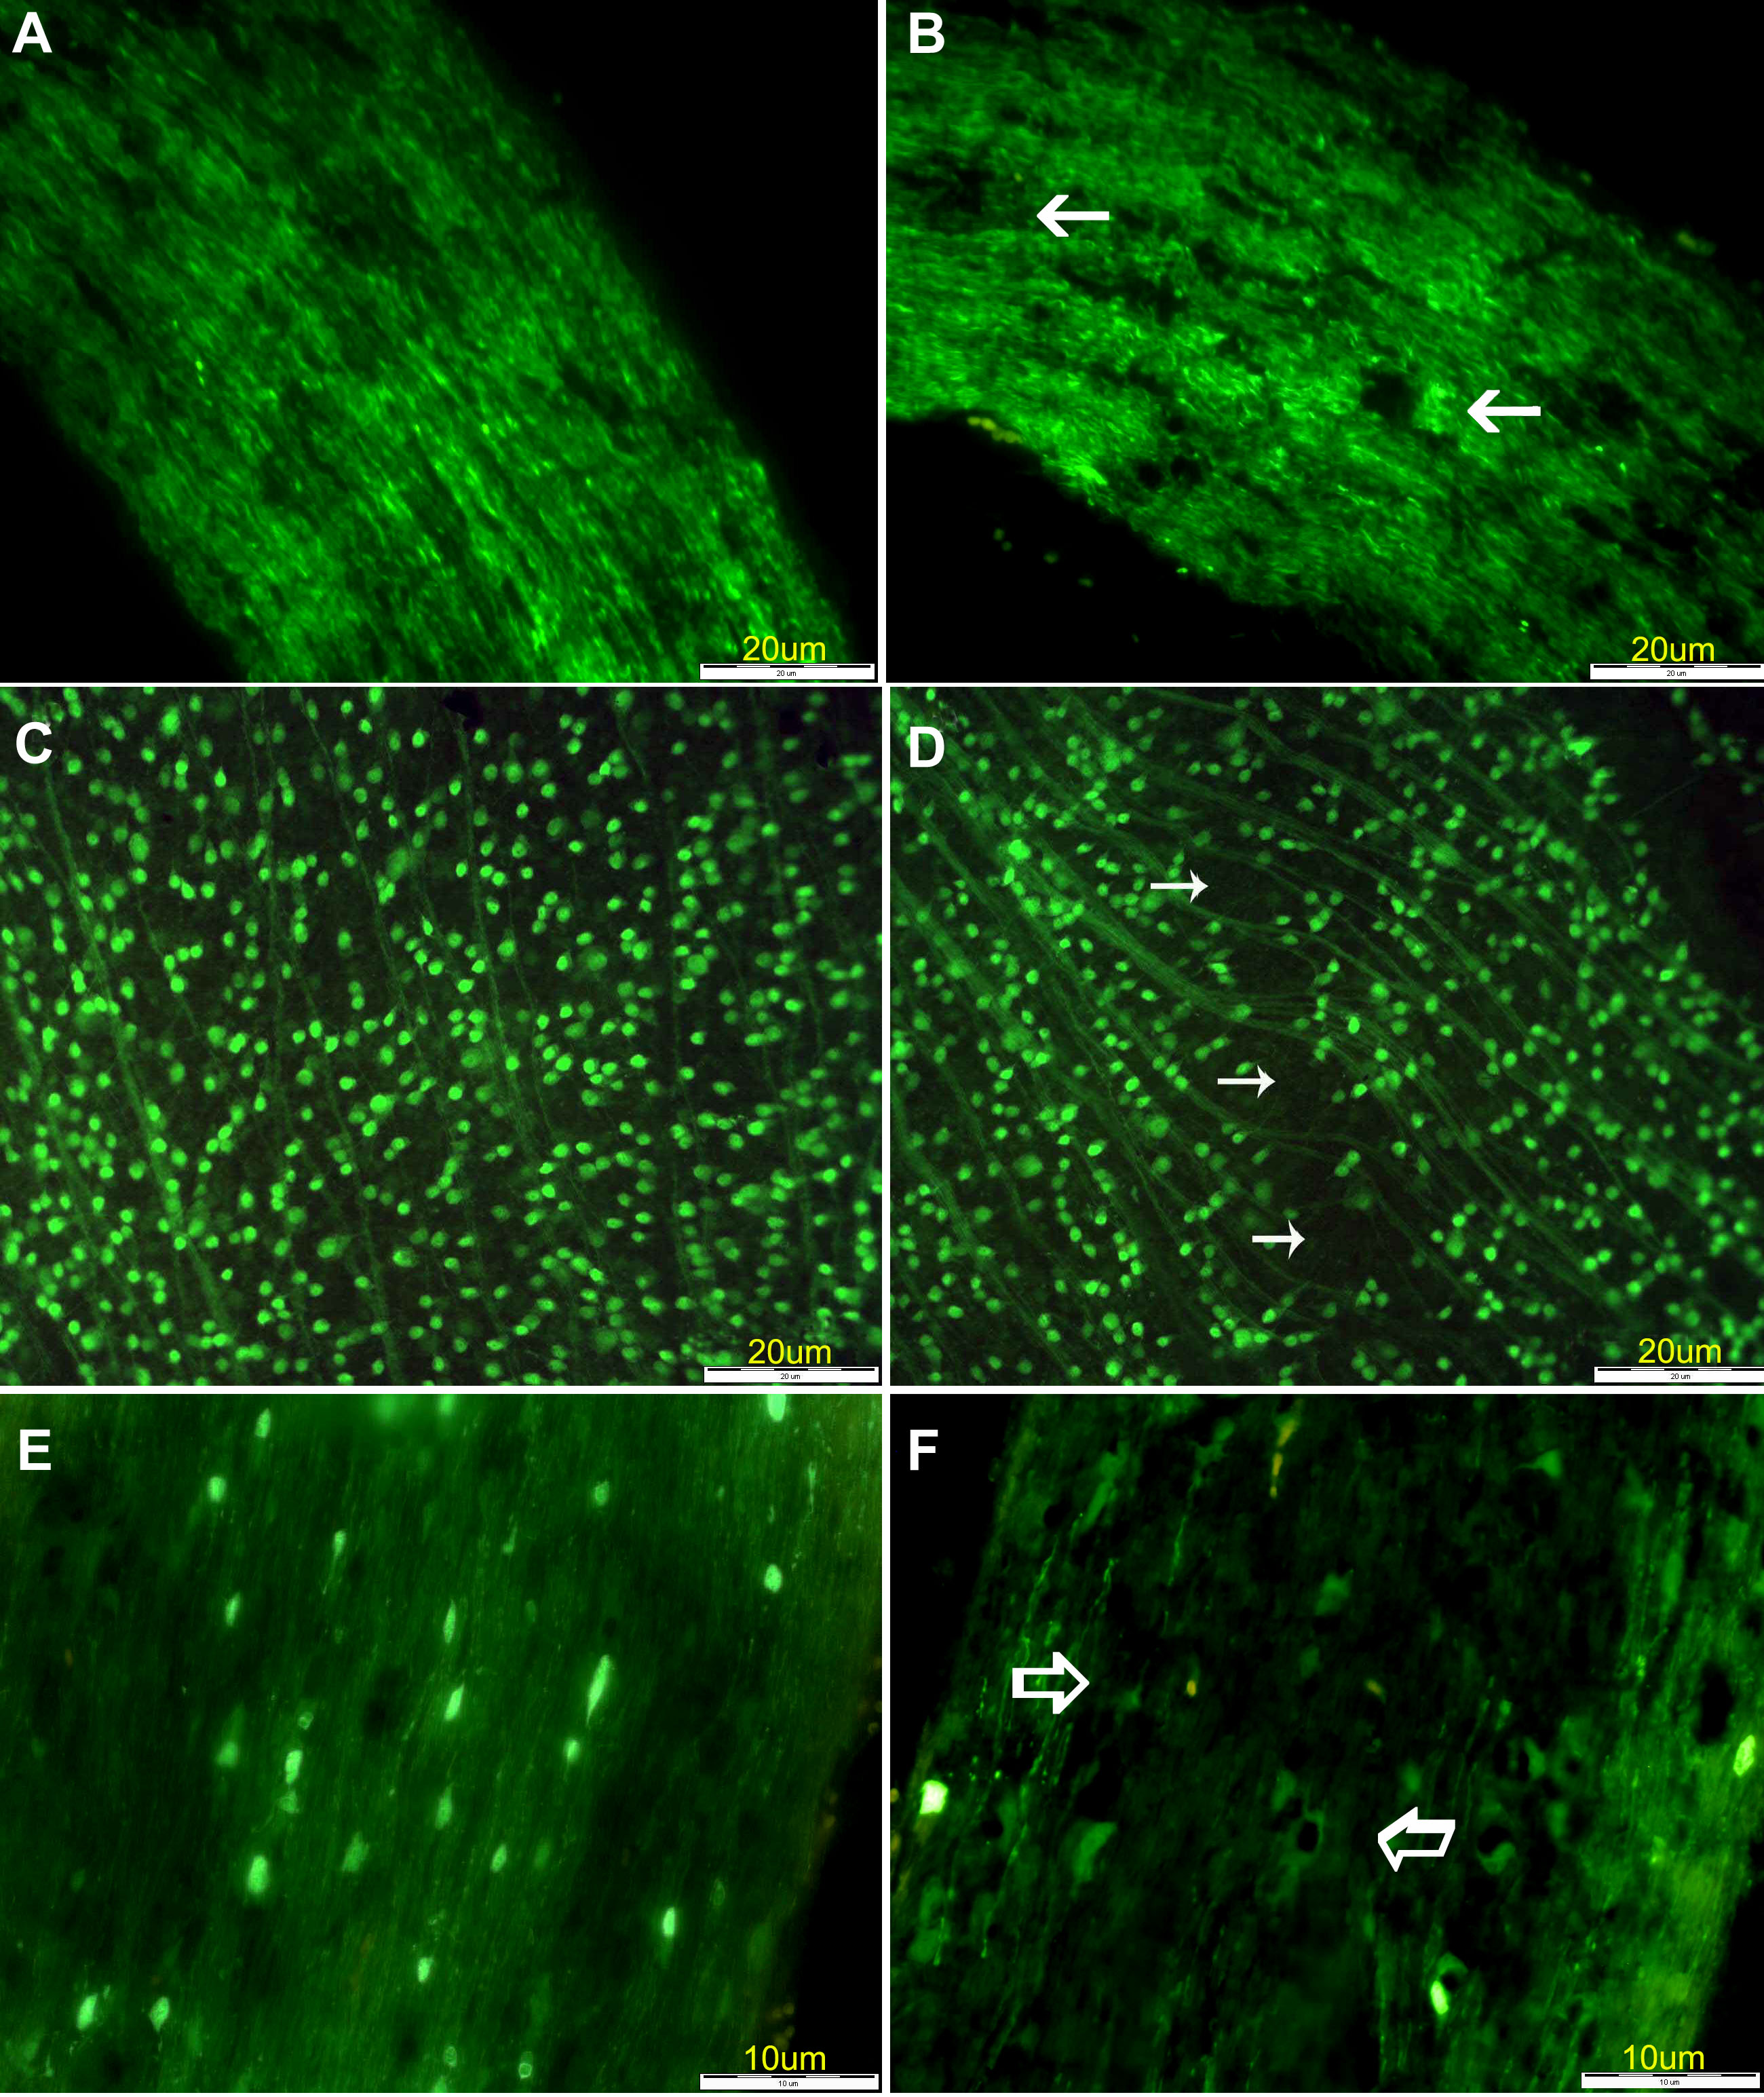
 Figure 4 of Dratviman-Storobinsky, Mol Vis 2008; 14:2171-2179.