Figure 3. Oligodendrocyte cell loss in
chiasm and optic nerves of CNPase-GFP mice at various intervals after
crush injury. A: Fourteen days
after crush injury; approximately
50% oligodendrocyte loss in right optic nerve (white arrow) as compared
to the left
optic nerve. Note the thin right optic nerve and the reduced
fluorescence
signal in the right axonal fibers crossing the chiasm toward the
contralateral
lateral geniculate body. B Ipsilateral
(right) and C contralateral
(left) lateral geniculate body
(LGB) with 25% oligodendrocyte cell loss in the latter. D
and E: Hoechst
staining of both LGB can be seen, with
20% cell loss contralateral to the injured nerve (same magnification,
10X).
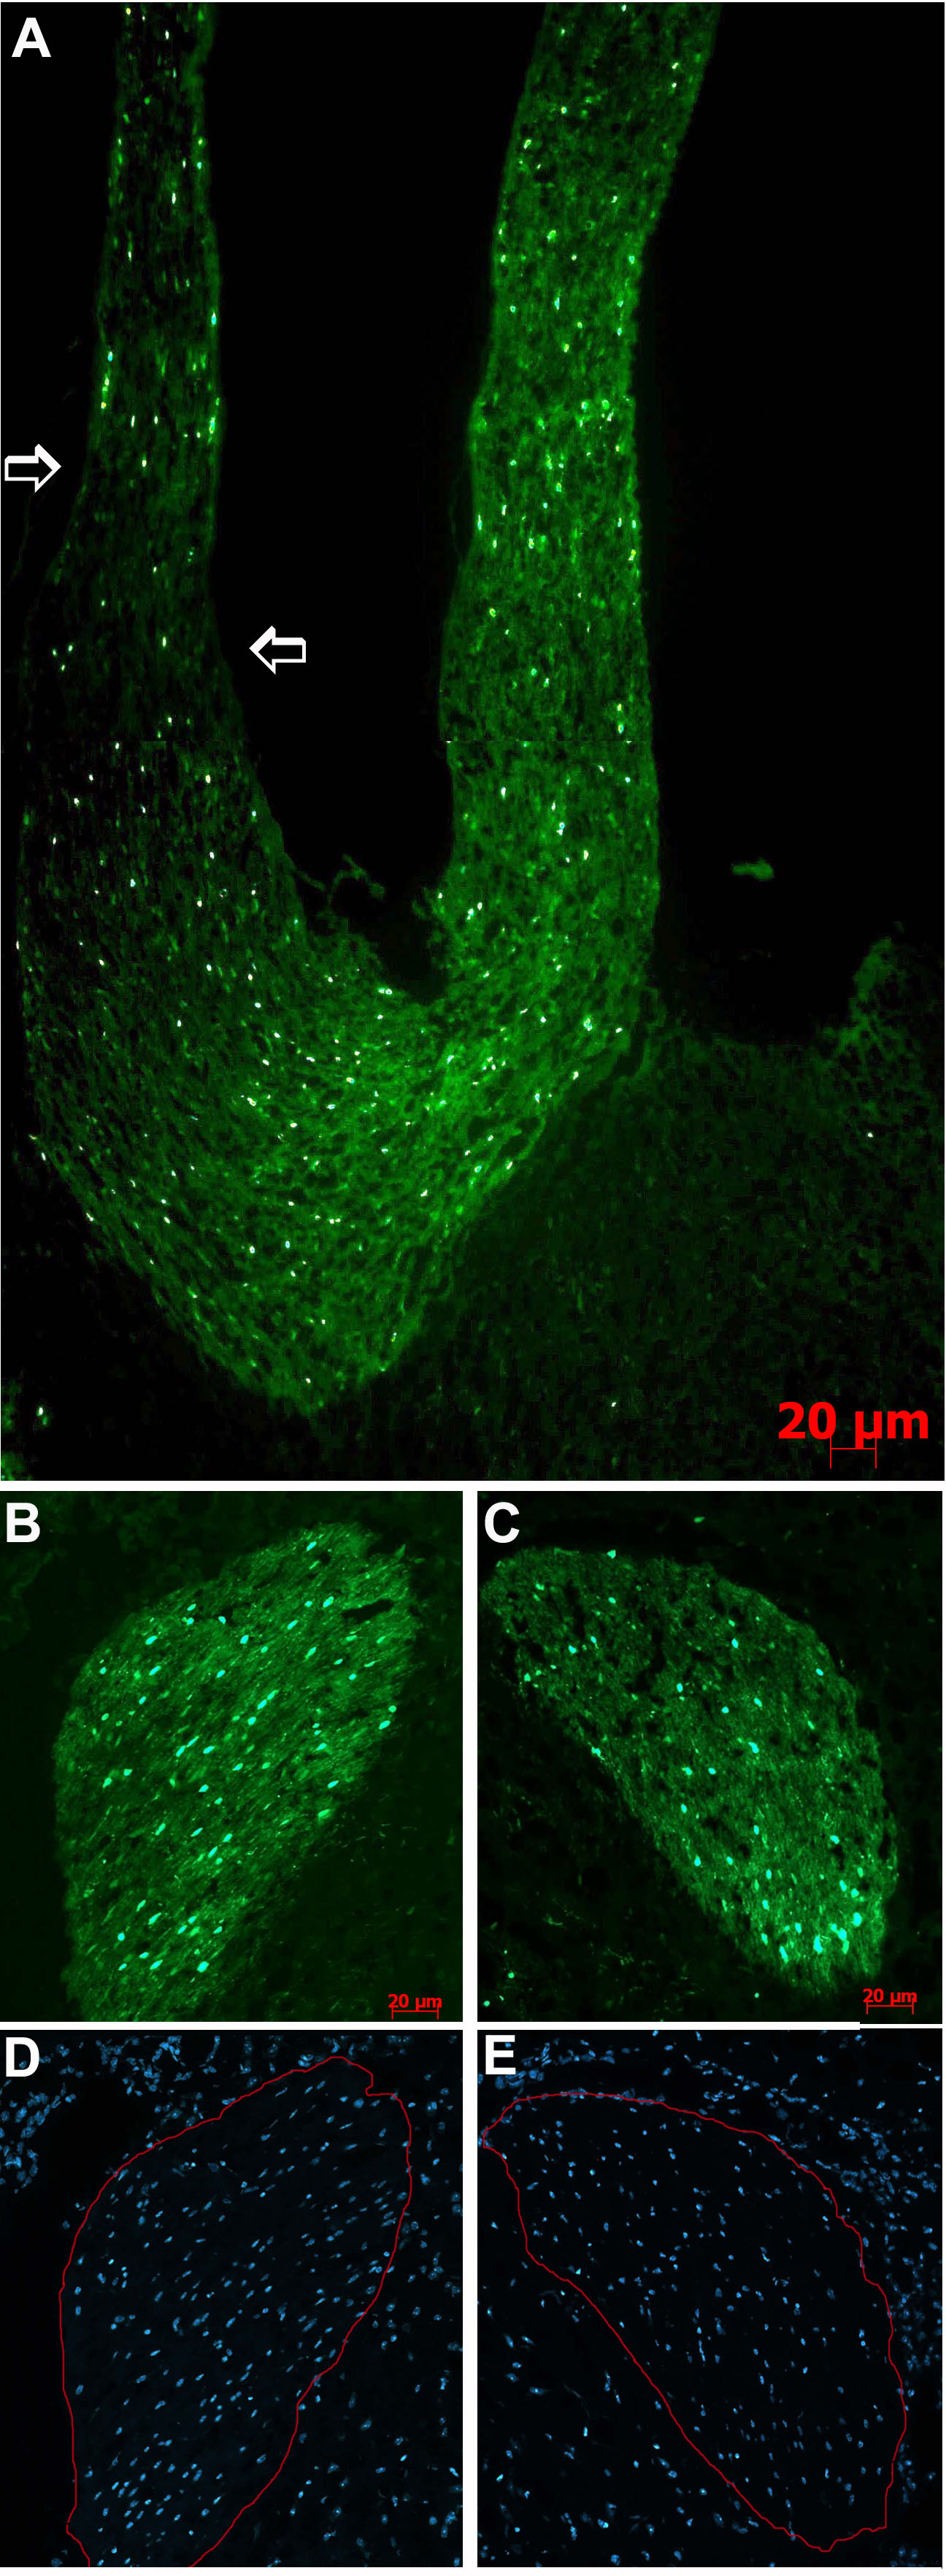
 Figure 3 of Dratviman-Storobinsky, Mol Vis 2008; 14:2171-2179.