Figure 4. Images were resampled to correct
the irregular data density of the raw scans. The Z axis (vertical axis
of the image) is fixed at 1,024 reflectance measurements along a 2 mm
line. A X,Y scanning pattern was optimized for the body of the animal,
with a X,Y a-scan density of 501x180, yielding the uncorrected aspect
ratio observed in the left frame. Scan data were resampled, utilizing
spline interpolation, to produce images with a 1:1 aspect ratio for
structural measurements and visualization.
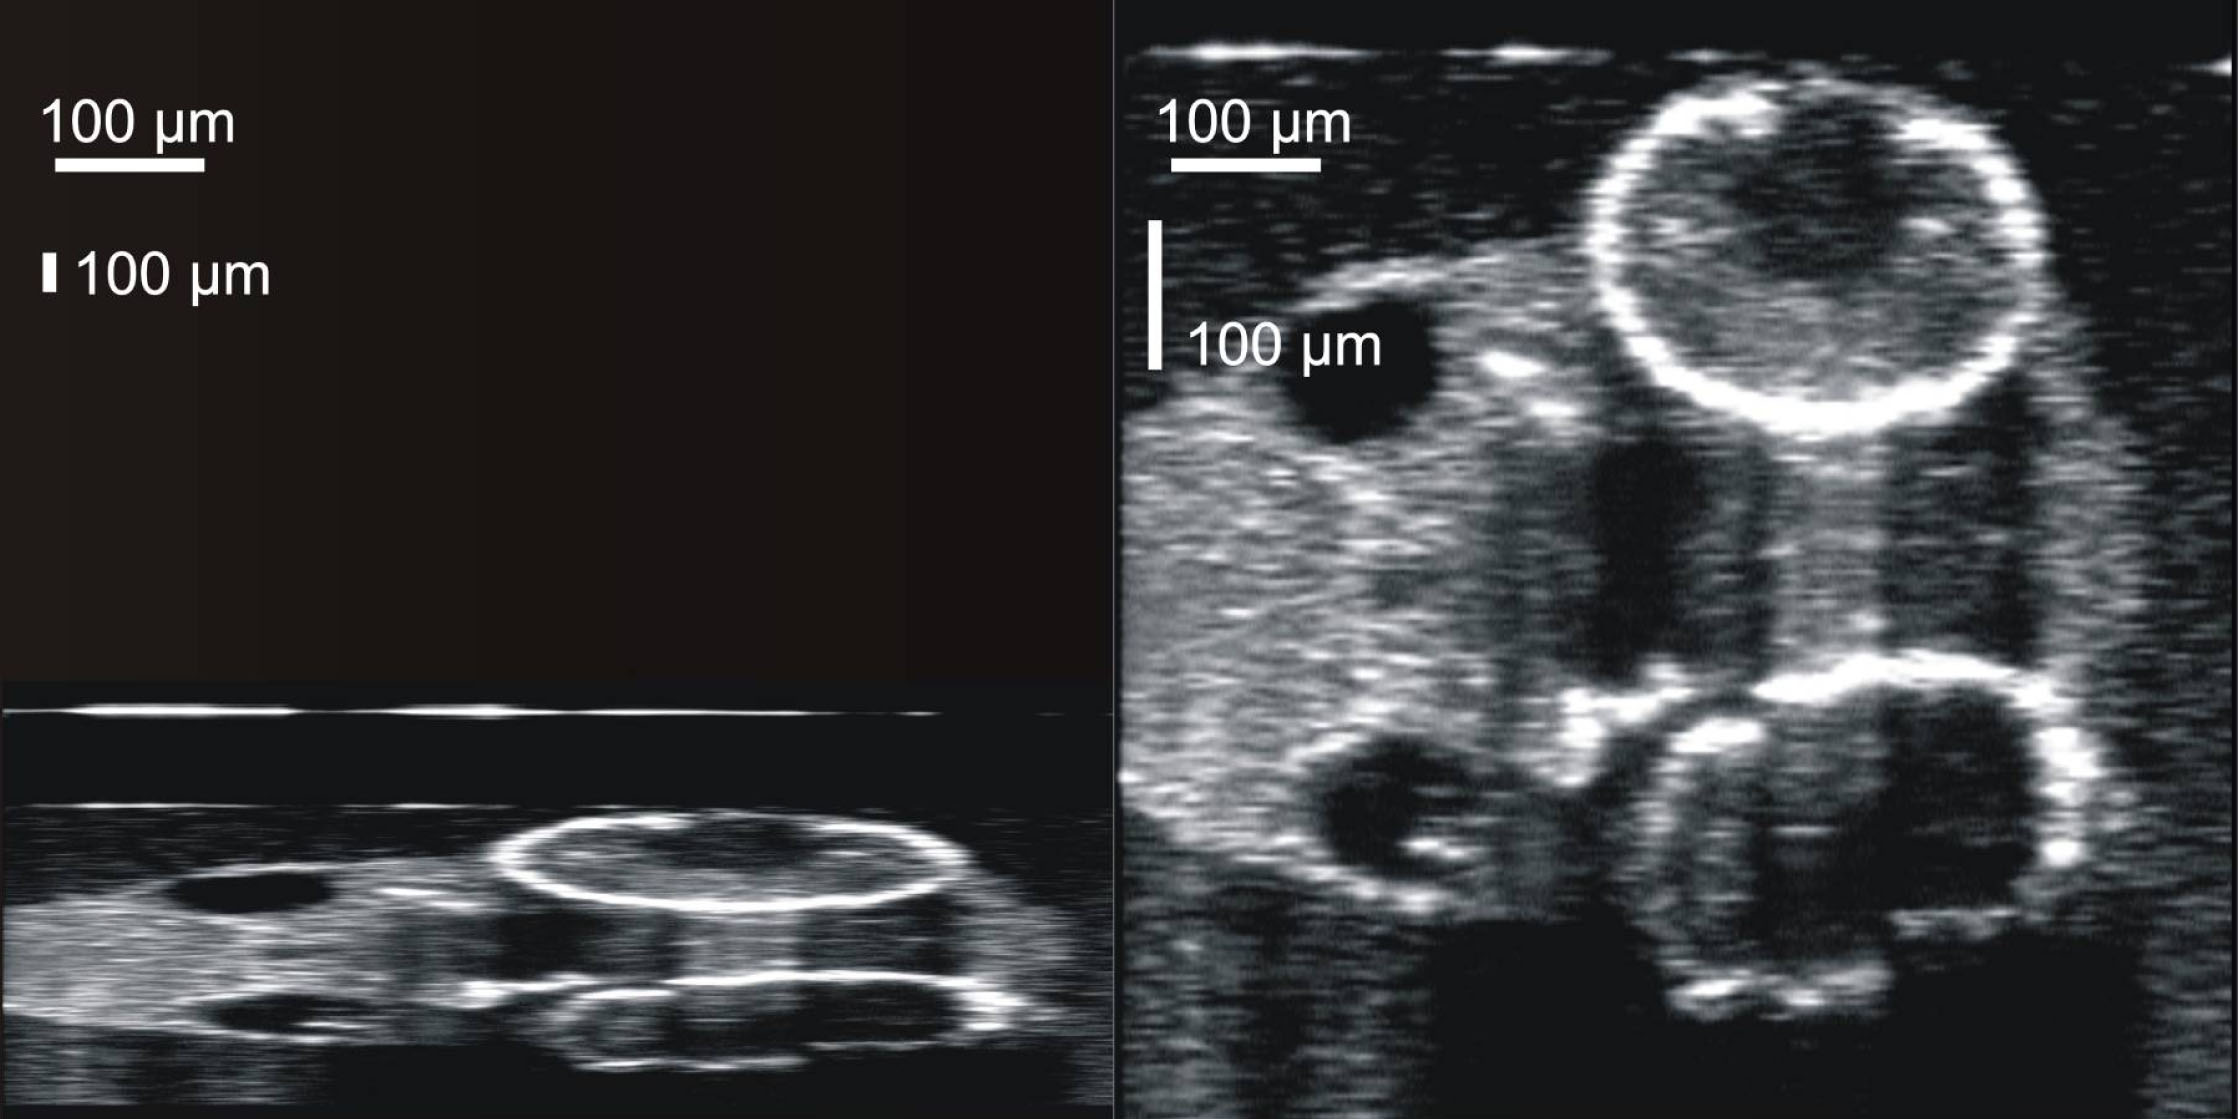
 Figure 4 of Kagemann, Mol Vis 2008; 14:2157-2170.