Figure 4 of
Zanon-Moreno, Mol Vis 2008; 14:2143-2147.
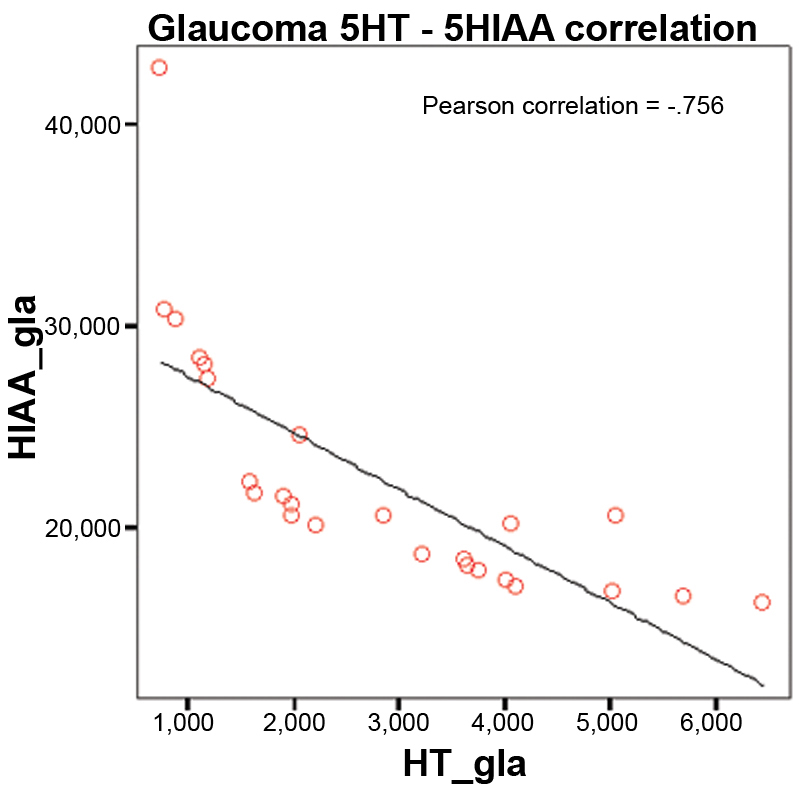
Figure 4.
Pearson’s correlation between 5-HT and 5-HIAA in the glaucoma group. The chart shows a statistically significant negative correlation between serotonin and hydroxiindolacetic acid in glaucoma group (p=0.000).
 Figure 4 of
Zanon-Moreno, Mol Vis 2008; 14:2143-2147.
Figure 4 of
Zanon-Moreno, Mol Vis 2008; 14:2143-2147.