Figure 1 of
Li, Mol Vis 2008; 14:2136-2142.
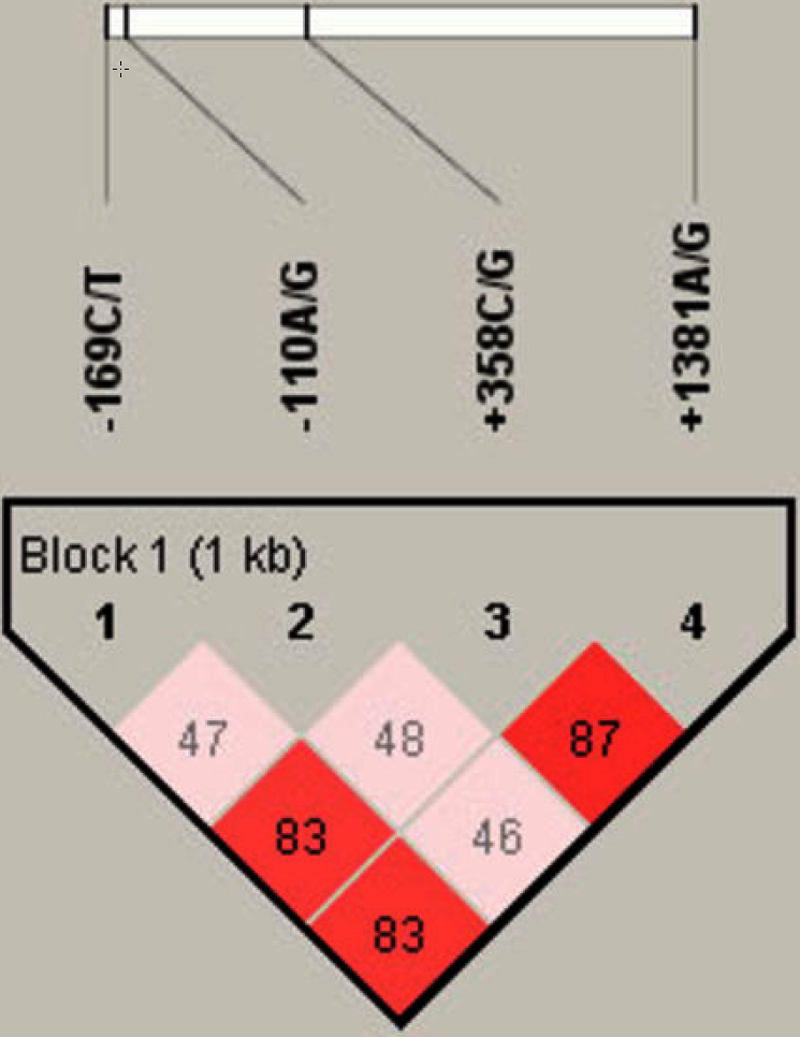
Figure 1.
Location and pair-wise linkage disequilibrium values of four
FCRL3
SNPs in a Chinese population. These four SNPs span 1 kb of the
FCRL3
region. Values of the pair-wise D’ (multiply by 100) are shown in one block.
 Figure 1 of Li, Mol Vis 2008; 14:2136-2142.