Figure 3. Differential expression of NGC
mRNA isoforms in Rpe65−/− mice. NGC-I (left
bars) and NGC-III (right bars) mRNA expression was assessed by
quantitative PCR on total RNA extracted from wild-type (wt) and Rpe65−/−
mice (ko) at 2, 6, and 12 months (n=3). Left panel shows retinal
samples and right panel RPE cell samples. Retinal NGC-I mRNA
expression (white bars) was compared to NGC-III mRNA levels
(red bars). Similarly, RPE NGC-I mRNA expression (blue bars)
was compared to NGC-III mRNA levels (green bars). Retinal NGC-I
mRNA expression of 2-month-old wild-type mice was arbitrarily set to 1.
For both panels, fold inductions±SEM are shown. By two-way ANOVA
retinal NGC-I and NGC-III mRNA levels were
significantly increased in Rpe65−/− mice
(p<0.01). Increase in NGC-III mRNA expression in the RPE was
also significant at 6 and 12 months (p<0.05).
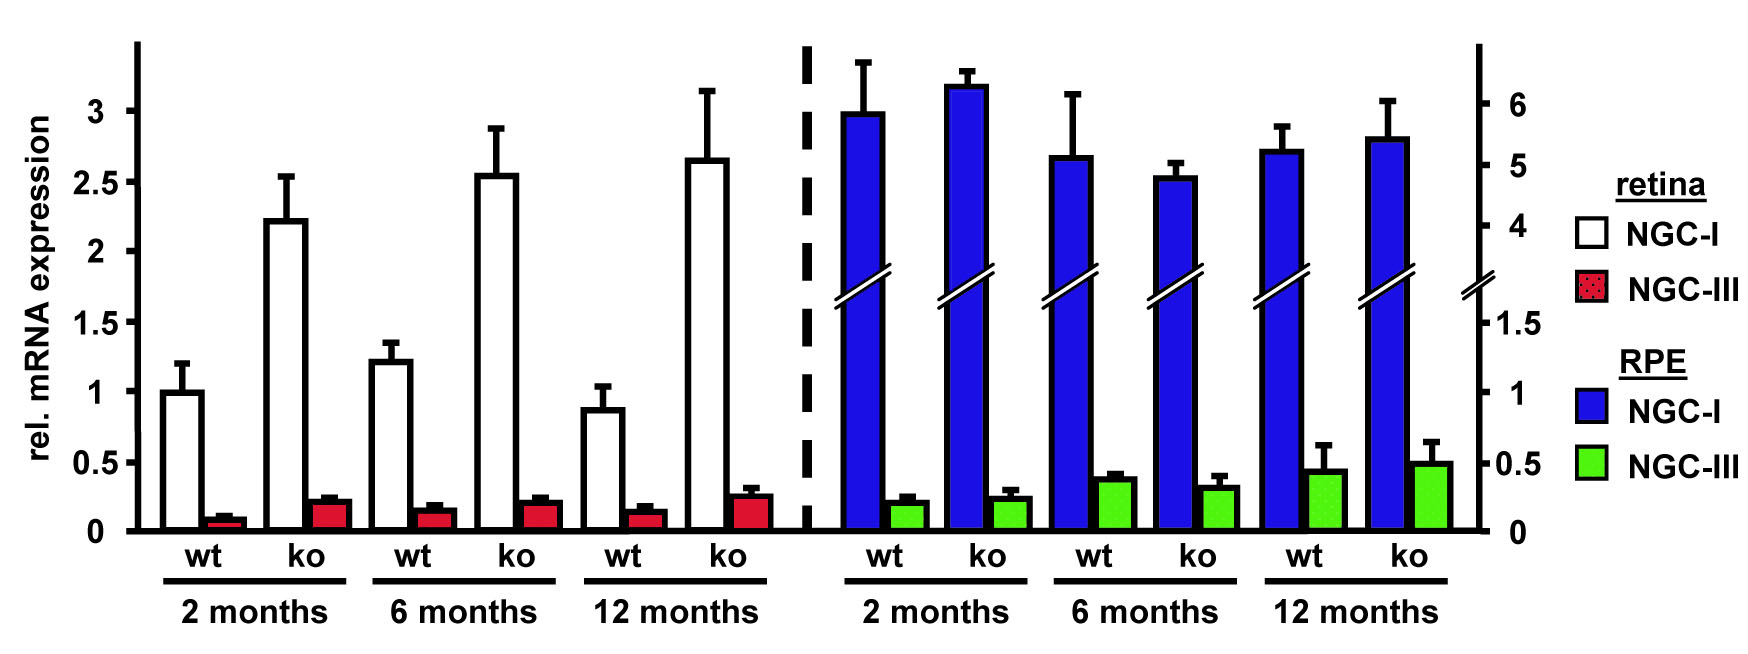
 Figure 3 of Escher, Mol Vis 2008; 14:2126-2135.