Figure 5. Co-localization of Prox1 and PCNA in Prox1 expressing tissues. A-C: Adult mouse lens, (A) Prox 1 (red) is found in the nuclei of all lens cells, although the relative amounts are higher in the lens fiber cells.
B: In contrast, PCNA (green) is found at variable levels in the transition zone and sharply downregulates early in fiber cell
differentiation. C: The overlap between the Prox1 and PCNA signals (white or yellow) shows that these molecules have the potential to interact
in the lens epithelium, particularly as the epithelial cells are making the fate decision to become fiber cells (arrowhead).
Scale bar=77 μm. D-F: 16.5 days post coitum (dpc) mouse liver, (D) Prox1 (red) is found in a subset of embryonic liver cells. E: PCNA (green) is expressed by almost all cells of the embryonic mouse liver. F: High levels of PCNA (green) and Prox1 (red) are not typically co-localized, but such co-localization (arrowhead) is found
in some cell nuclei (yellow). Scale bar=24 μm. G-I: Adult mouse liver, (G) Prox1 (red) is found in a subset of adult liver cells. H: PCNA (green) is only found in a small subset of adult liver cells. I: High levels of PCNA (green) and Prox1 (red) are usually co-localized (arrowhead) in cell nuclei (yellow). Scale bar=24 μm.
Blue signal in panels C, F, and I is the DNA stain DraqV.
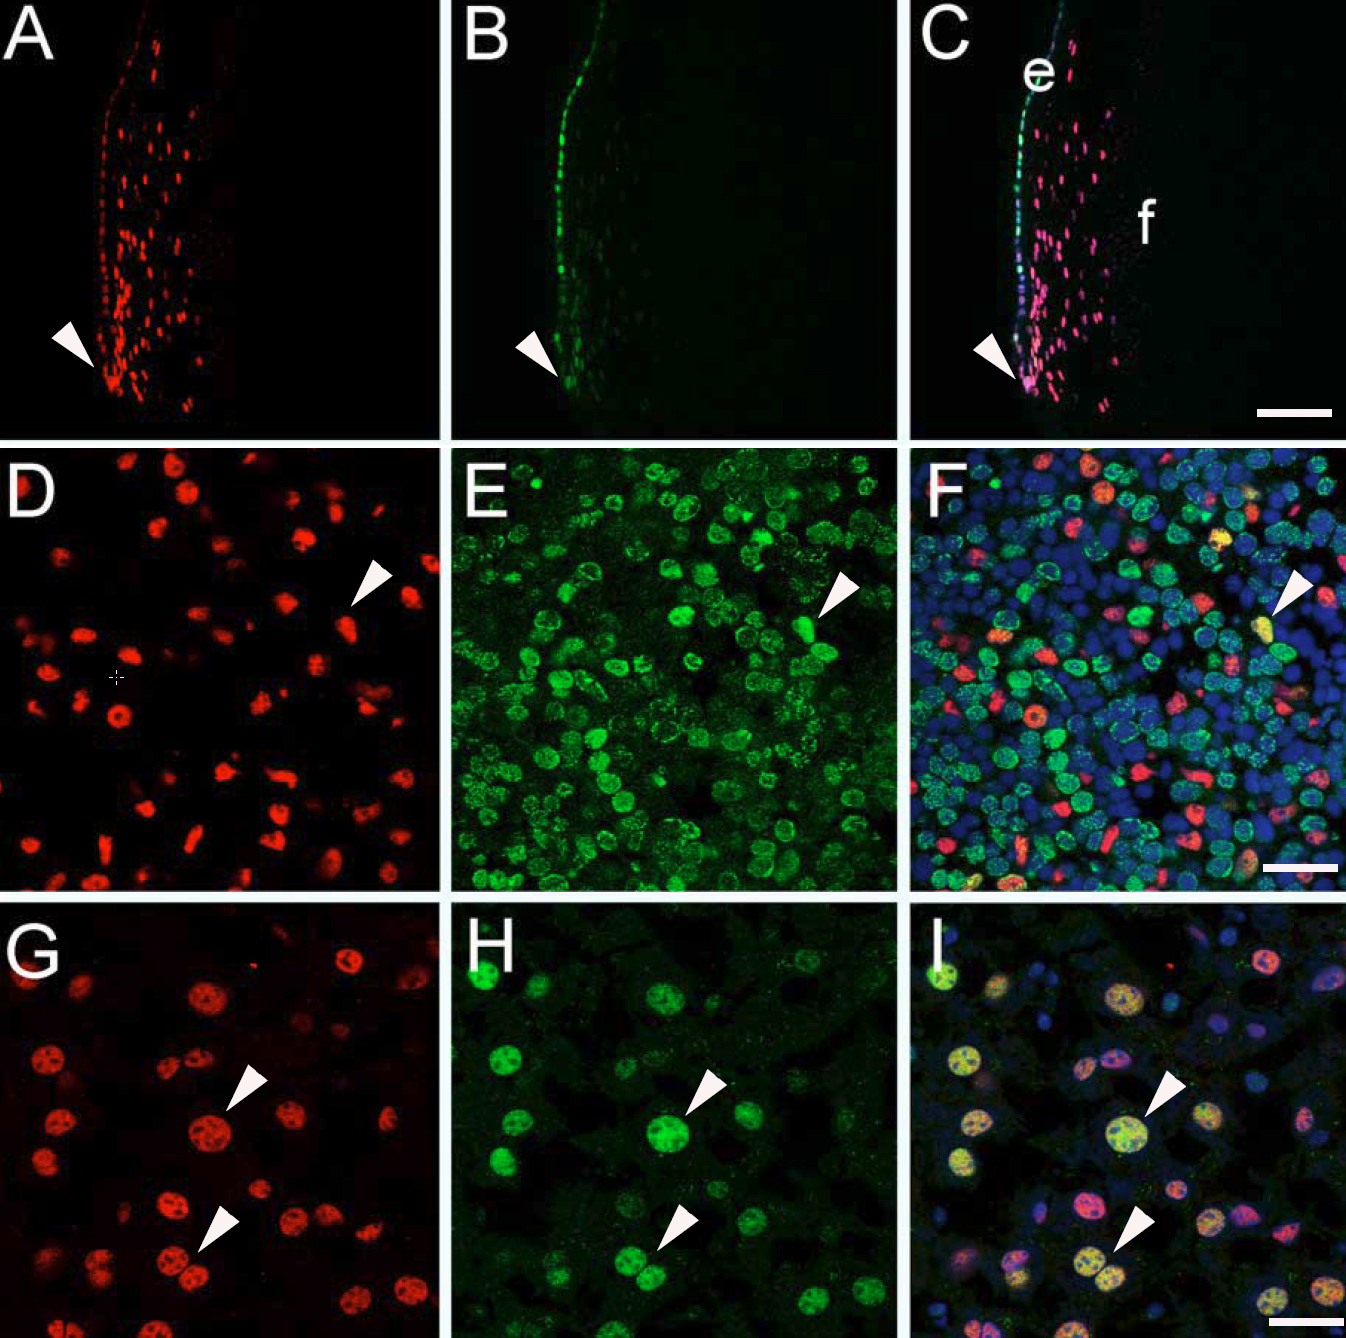
 Figure 5 of
Chen, Mol Vis 2008; 14:2076-2086.
Figure 5 of
Chen, Mol Vis 2008; 14:2076-2086.