Figure 4. Restriction fragment length analysis on the three mutations detected in this study. A: c.99_100insT created a TaqaI restriction site that cosegregated with the affected individuals and the carriers (370 bp, 470 bp, and 840 bp), but not
with unaffected individuals and normal controls (840bp). B: c.8483delC created an MslI restriction site that cosegregated with the affected individuals and the carriers (150 bp, 340
bp, and 490 bp), but not with unaffected individuals and normal control (490 bp). C: c.9450G>A created an EcoRV restriction site that cosegregated with the affected individuals and the carriers (265 bp, and
530 bp), but not with unaffected individuals and normal control (530 bp). Participant identification number is given above
each lane. N represents the normal control, and M refers to the DNA ladder in bp.
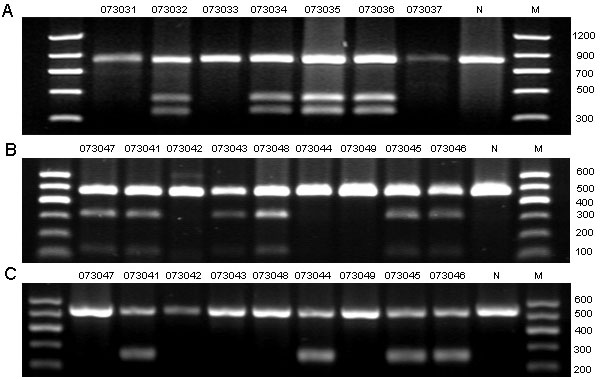
 Figure 4 of
Dai, Mol Vis 2008; 14:2067-2075.
Figure 4 of
Dai, Mol Vis 2008; 14:2067-2075.