Figure 4. Standard displacement plot for
human total lens proteins as determined by non-competitive ELISA.
Percent binding of antibodies versus concentration of human total lens
proteins (1-1,000 ng) was used to generate an inhibition plot using
linear regression analysis. The affinity purified antisera was used at
a dilution of 1:40,000. Data points are mean ± SD (n = 5).
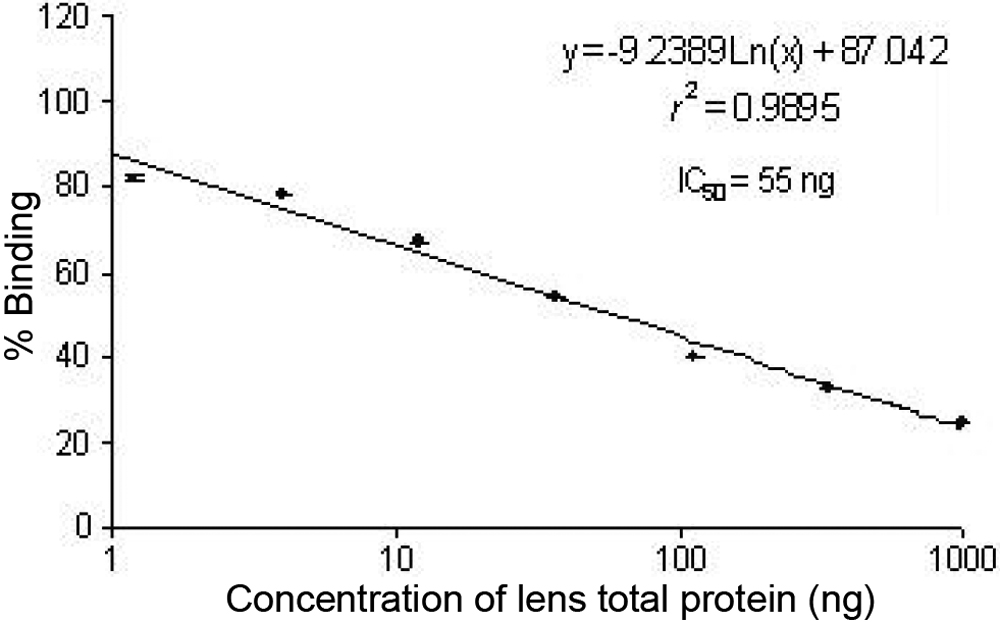
 Figure 4 of Ranjan, Mol Vis 2008; 14:2056-2066.