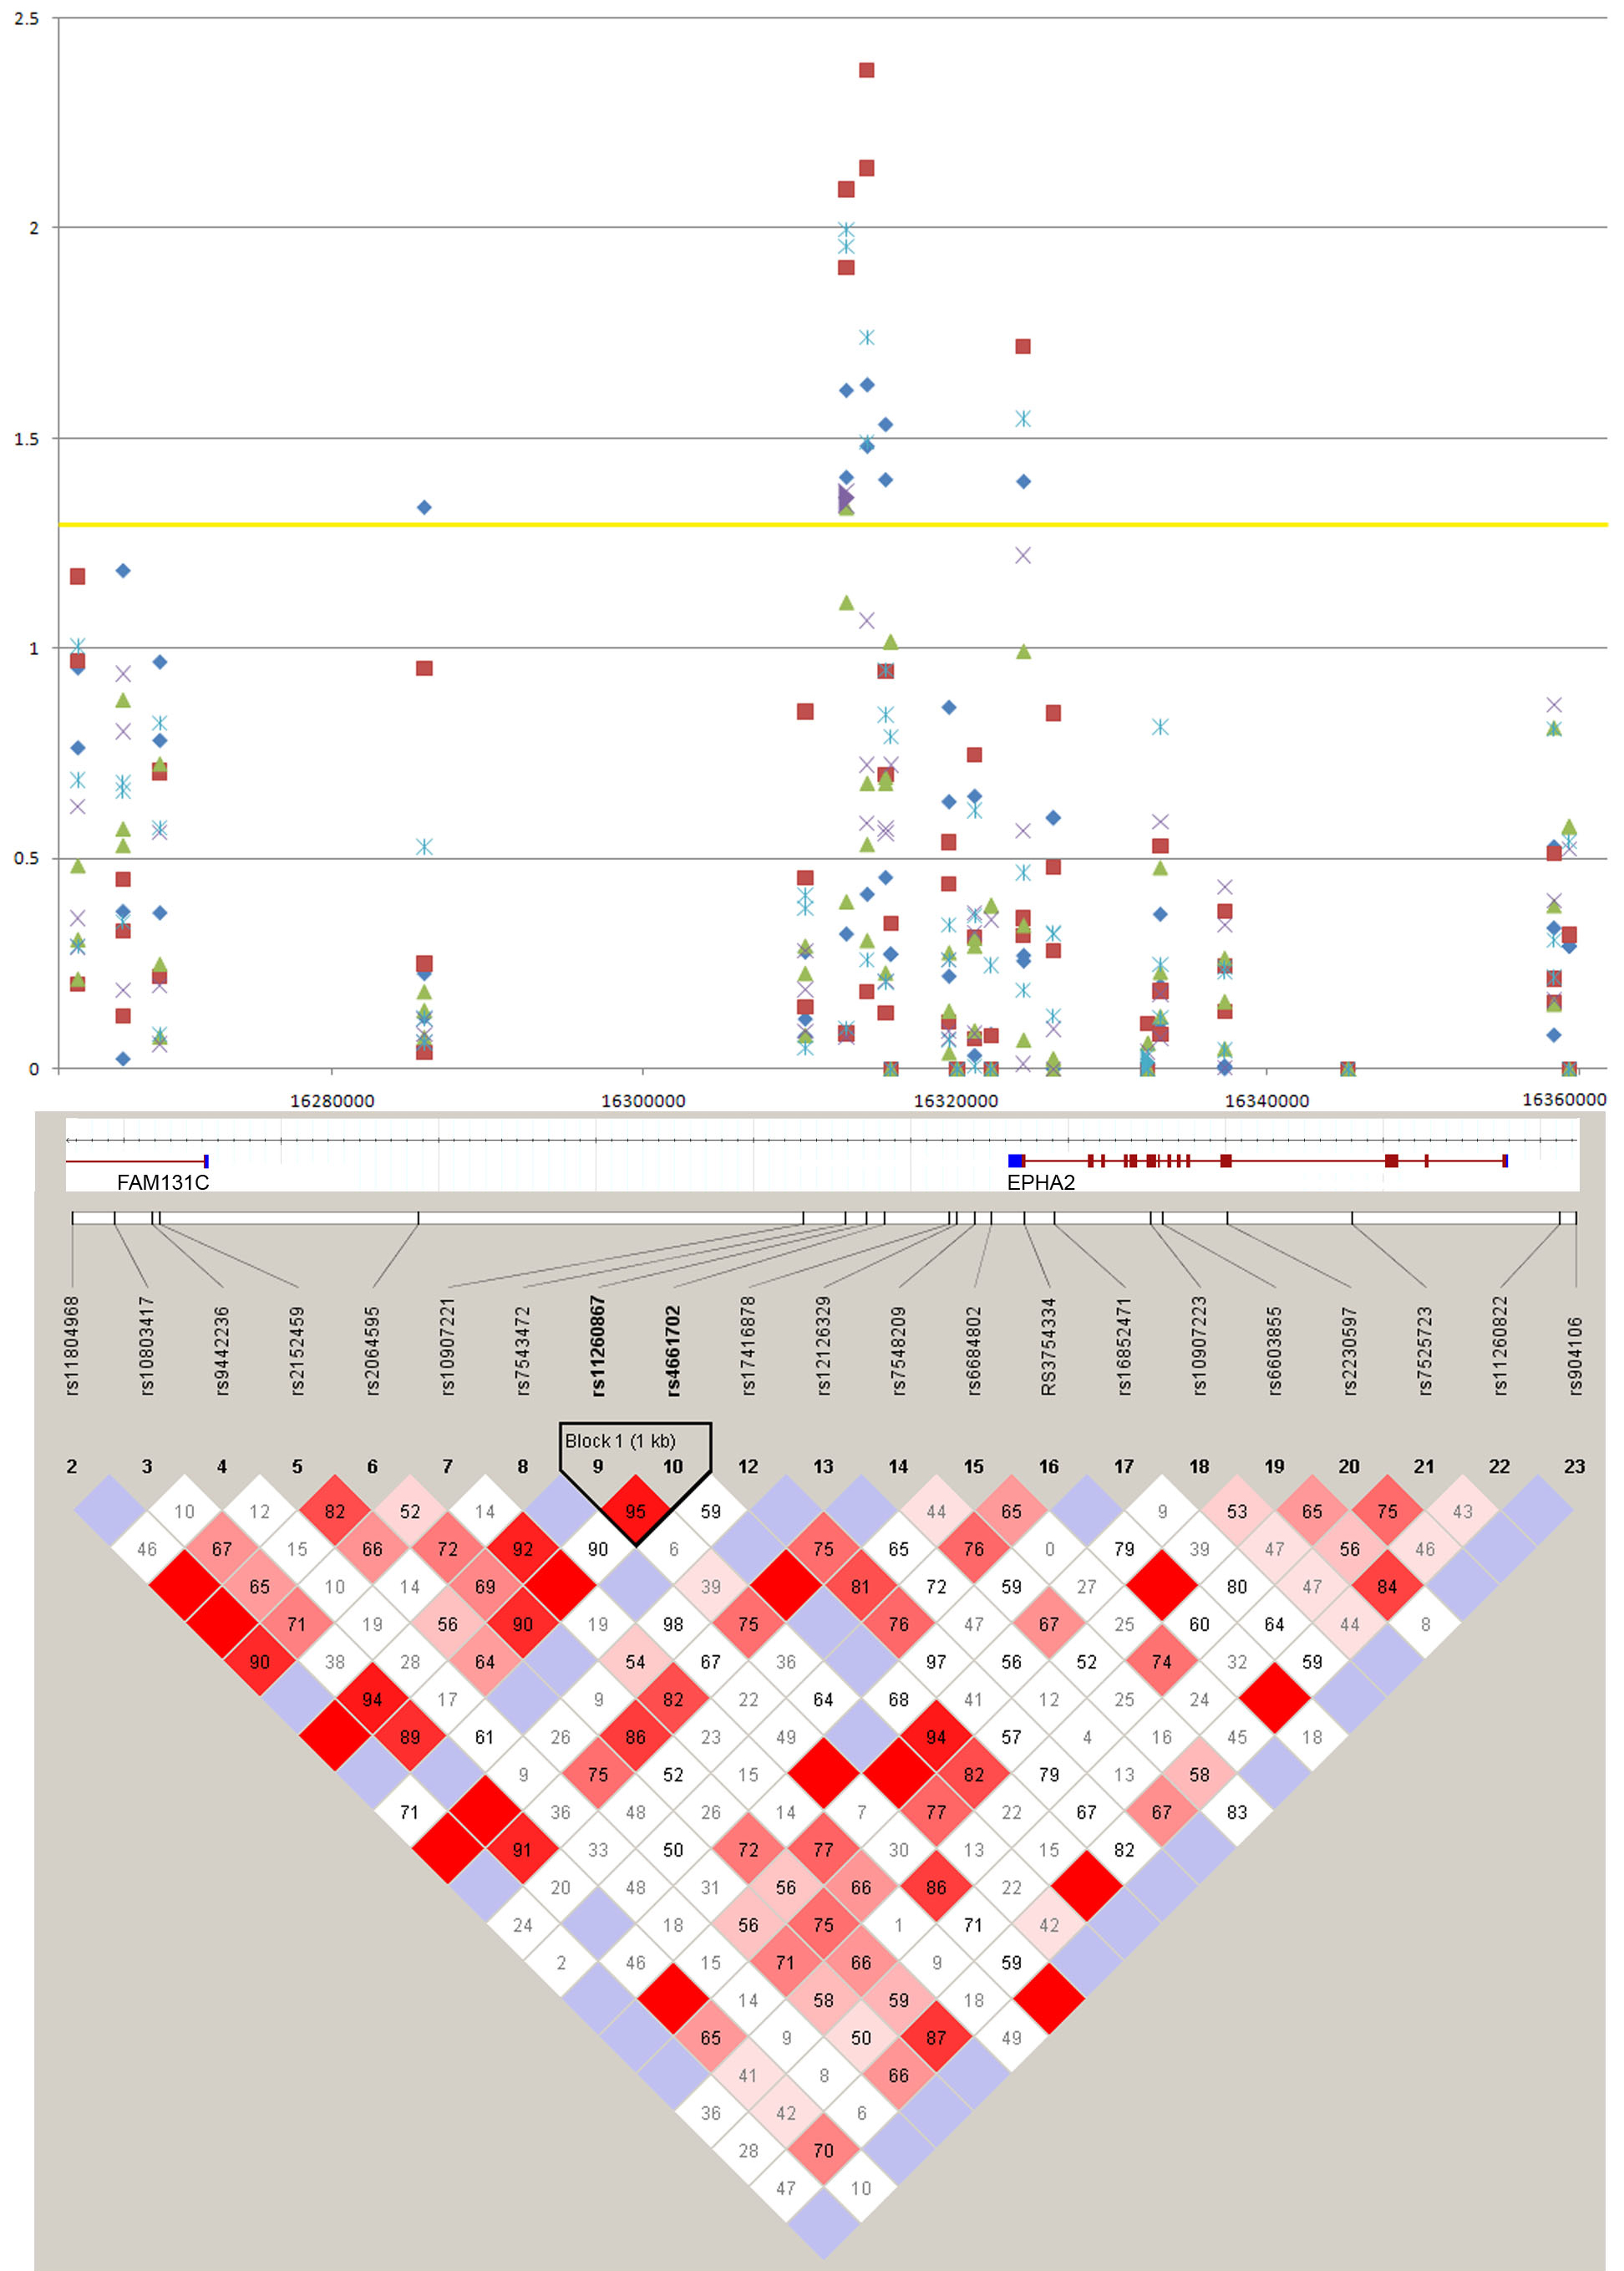
Figure 5. Graphical presentation of
association between SNPs in the
EPHA2 region of chromosome 1p
with age-related cataracts in the Italian case-control cohort. The
upper panel shows a plot of -log p-values (y-axis) from association
analyses of 21 SNPs across the
EPHA2 region. Blue diamonds
denote -log p values for pure cortical cataracts; red squares, any
cortical cataracts; green triangles, pure nuclear cataracts; purple x,
any nuclear cataracts; and light blue asterisks, any cataracts. The
x-axis shows the relative physical location of each SNP measured in
mega-base-pairs. The lower panel shows a pairwise linkage
disequilibrium (D´)
Haploview
plot for SNPs in the
EPHA2 region. The strength of linkage
disequilibrium (LD) is color-coded; red indicates strong LD with SNPs
showing high correlation, and blue indicates low LD and high
recombination. The relative positions of
EPHA2 and the
adjacent
FAM131C are indicated with haplotype blocks for the
European population (CEU) from the
HapMap
project (SNPbrowser, Applied Biosystems).
 Figure 5 of Shiels, Mol Vis 2008; 14:2042-2055.