Figure 3. Levels of mRNA of nine transcripts obtained by microarray method were comparable to those obtained by QRT–PCR. Solid bars
represent expression values obtained by microarray, and the white bars represent expression values obtained by QRT–PCR. Abbreviations:
WIF1, Wnt inhibitory factor 1; HPGD, hydroxyprostaglandin dehydrogenase 15-(NAD); MYBPC1, myosin binding protein C; TYRP1, tyrosinase-related protein 1; KRT12, keratin 12; KRT13, keratin 13; PERP, TP53 apoptosis effector; TNC, tenascin C; HOP, homeodomain-only protein.
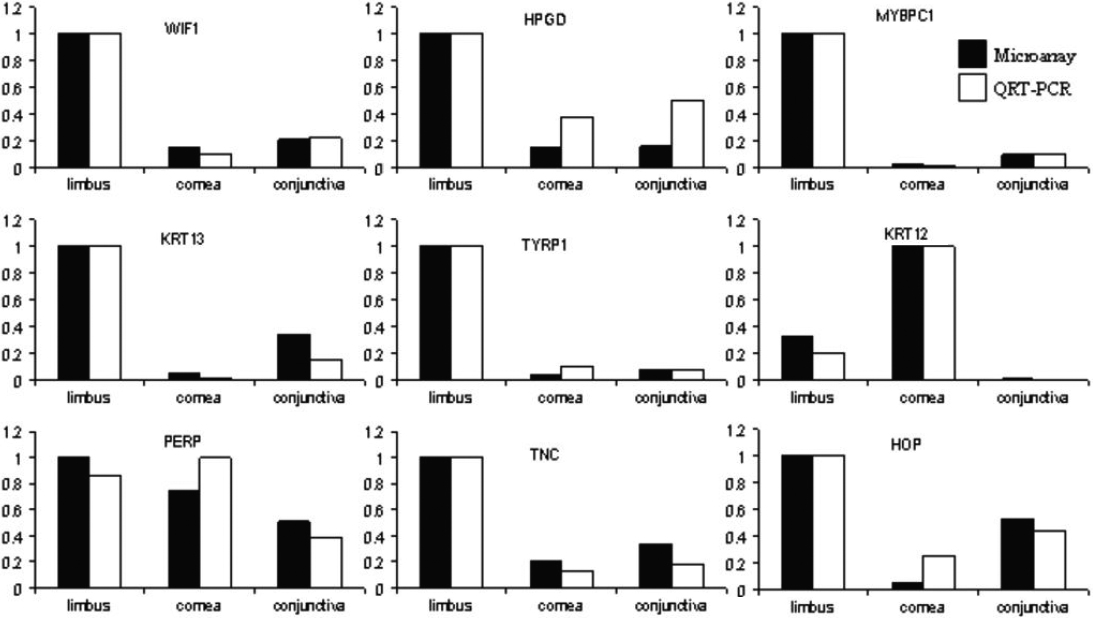
 Figure 3 of
Ding, Mol Vis 2008; 14:2031-2041.
Figure 3 of
Ding, Mol Vis 2008; 14:2031-2041.