Figure 3. Expression of markers of
epithelial stem cells and differentiation. RT-PCR analysis of
expression of markers for epithelial differentiation (A) and
stem cells (B) is shown. GAPDH was used as the normalizing
control. The RT-PCR results of cytokeratin K5 and connexin 43 show a
composite picture of PCR of cDNA from all three cells and the negative
control that were performed in the same experiment. All experiments
were performed twice with RNA isolated from a separate set of cultures.
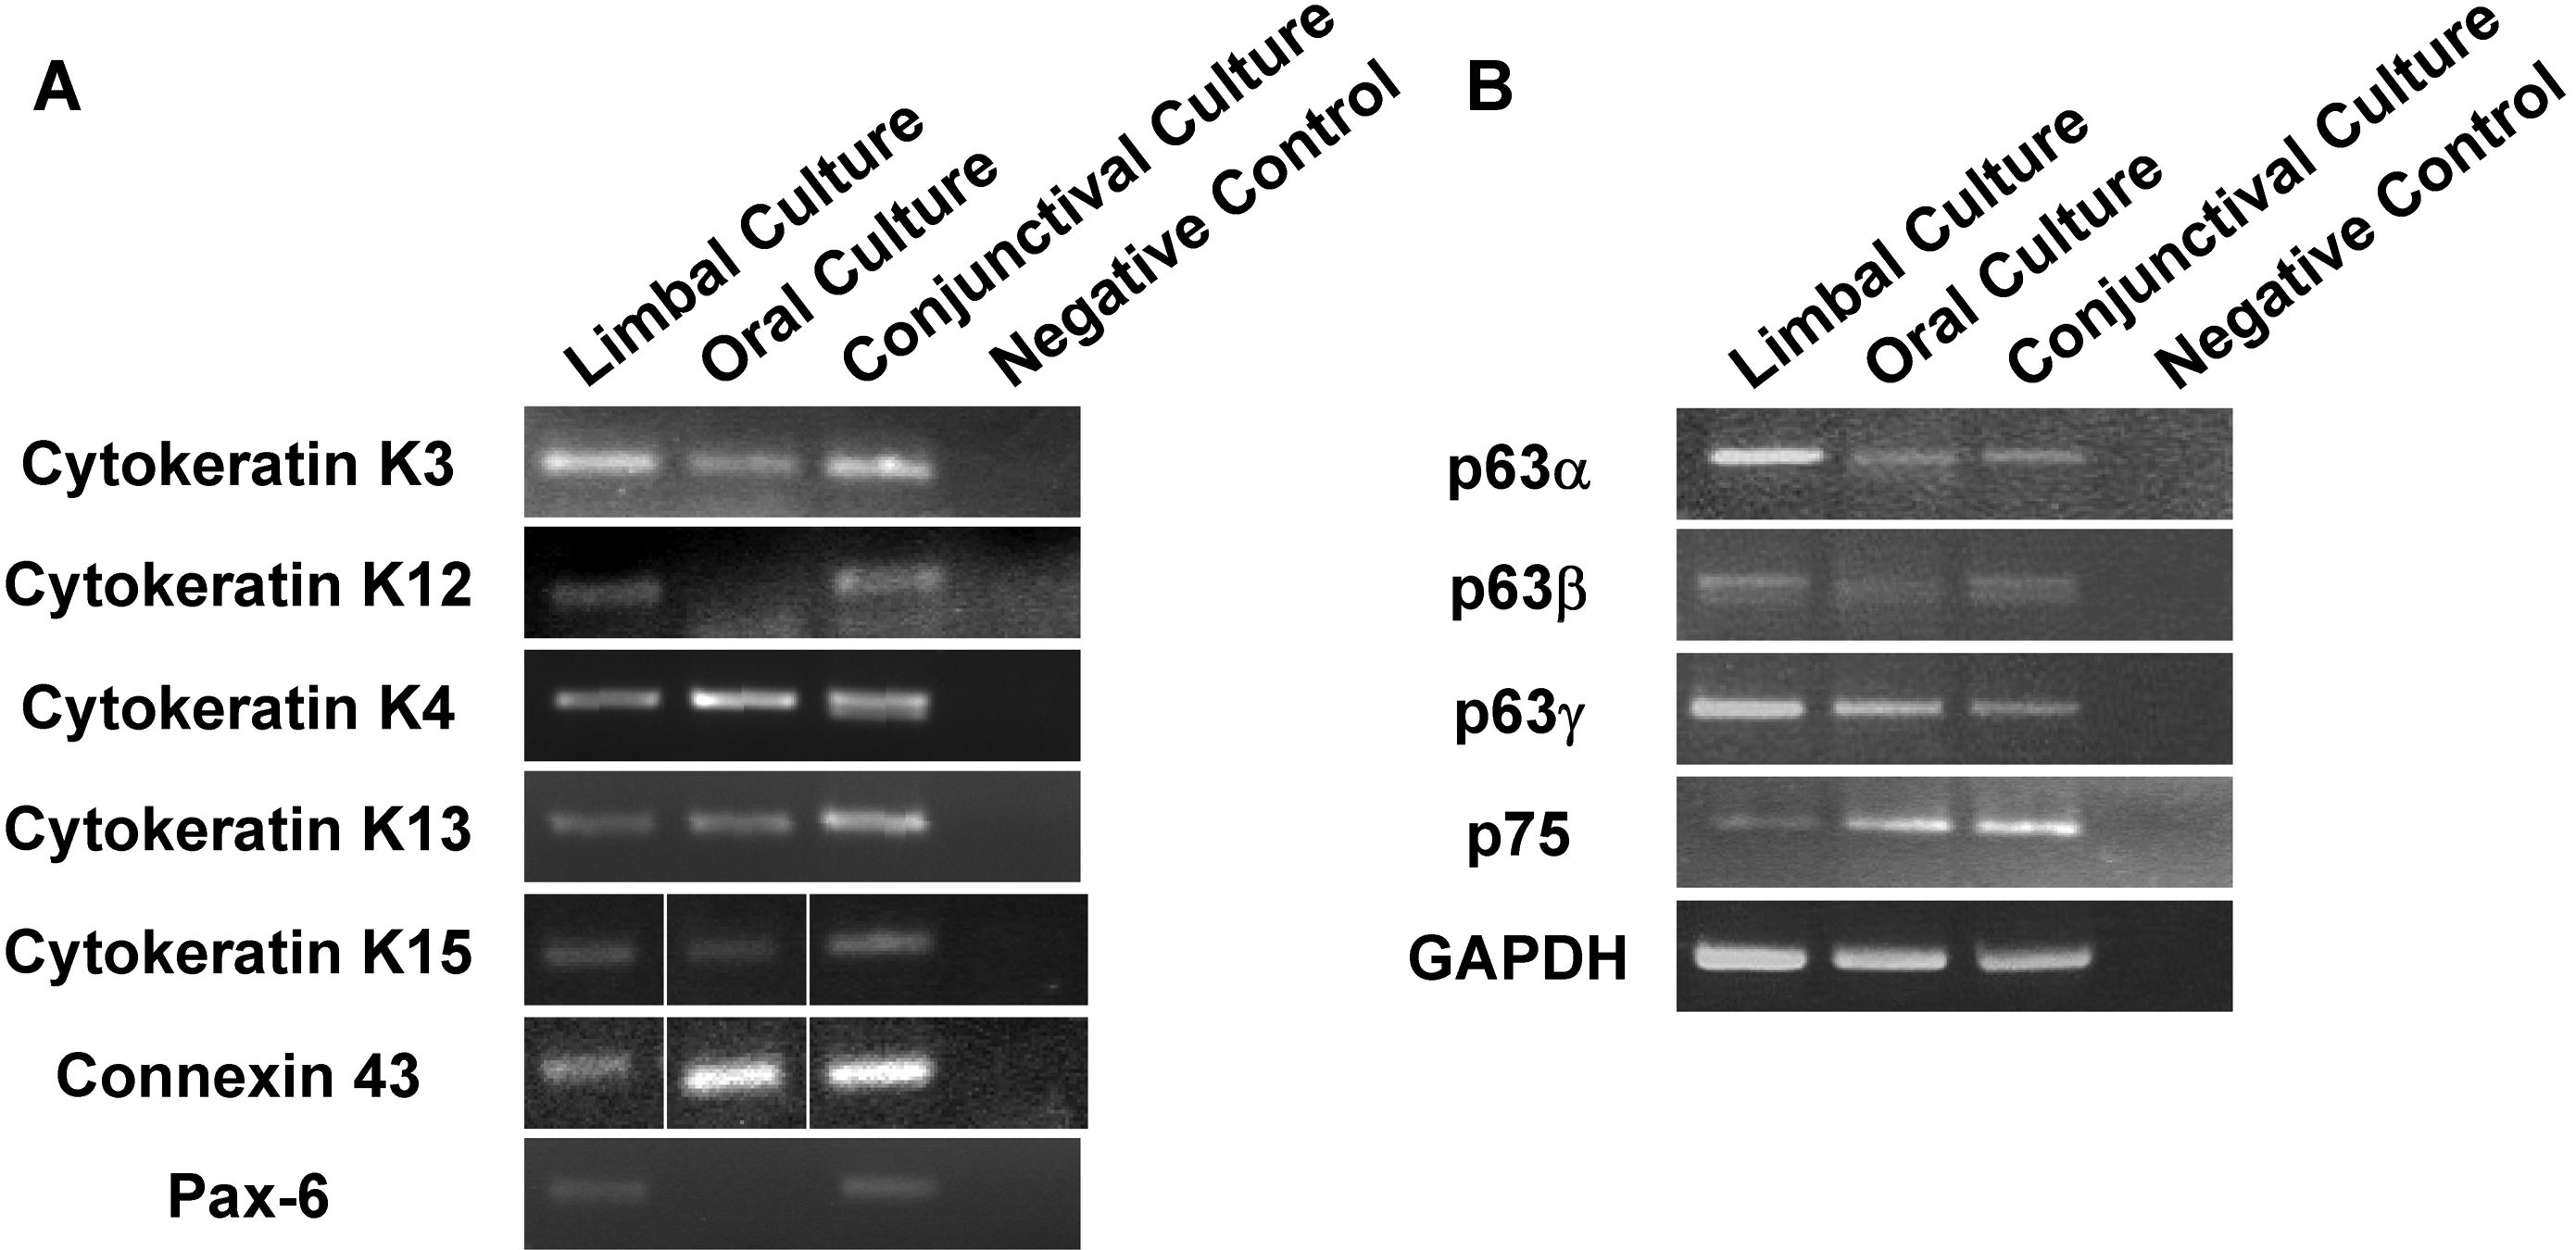
 Figure 3 of Madhira, Mol Vis 2008; 14:189-196.