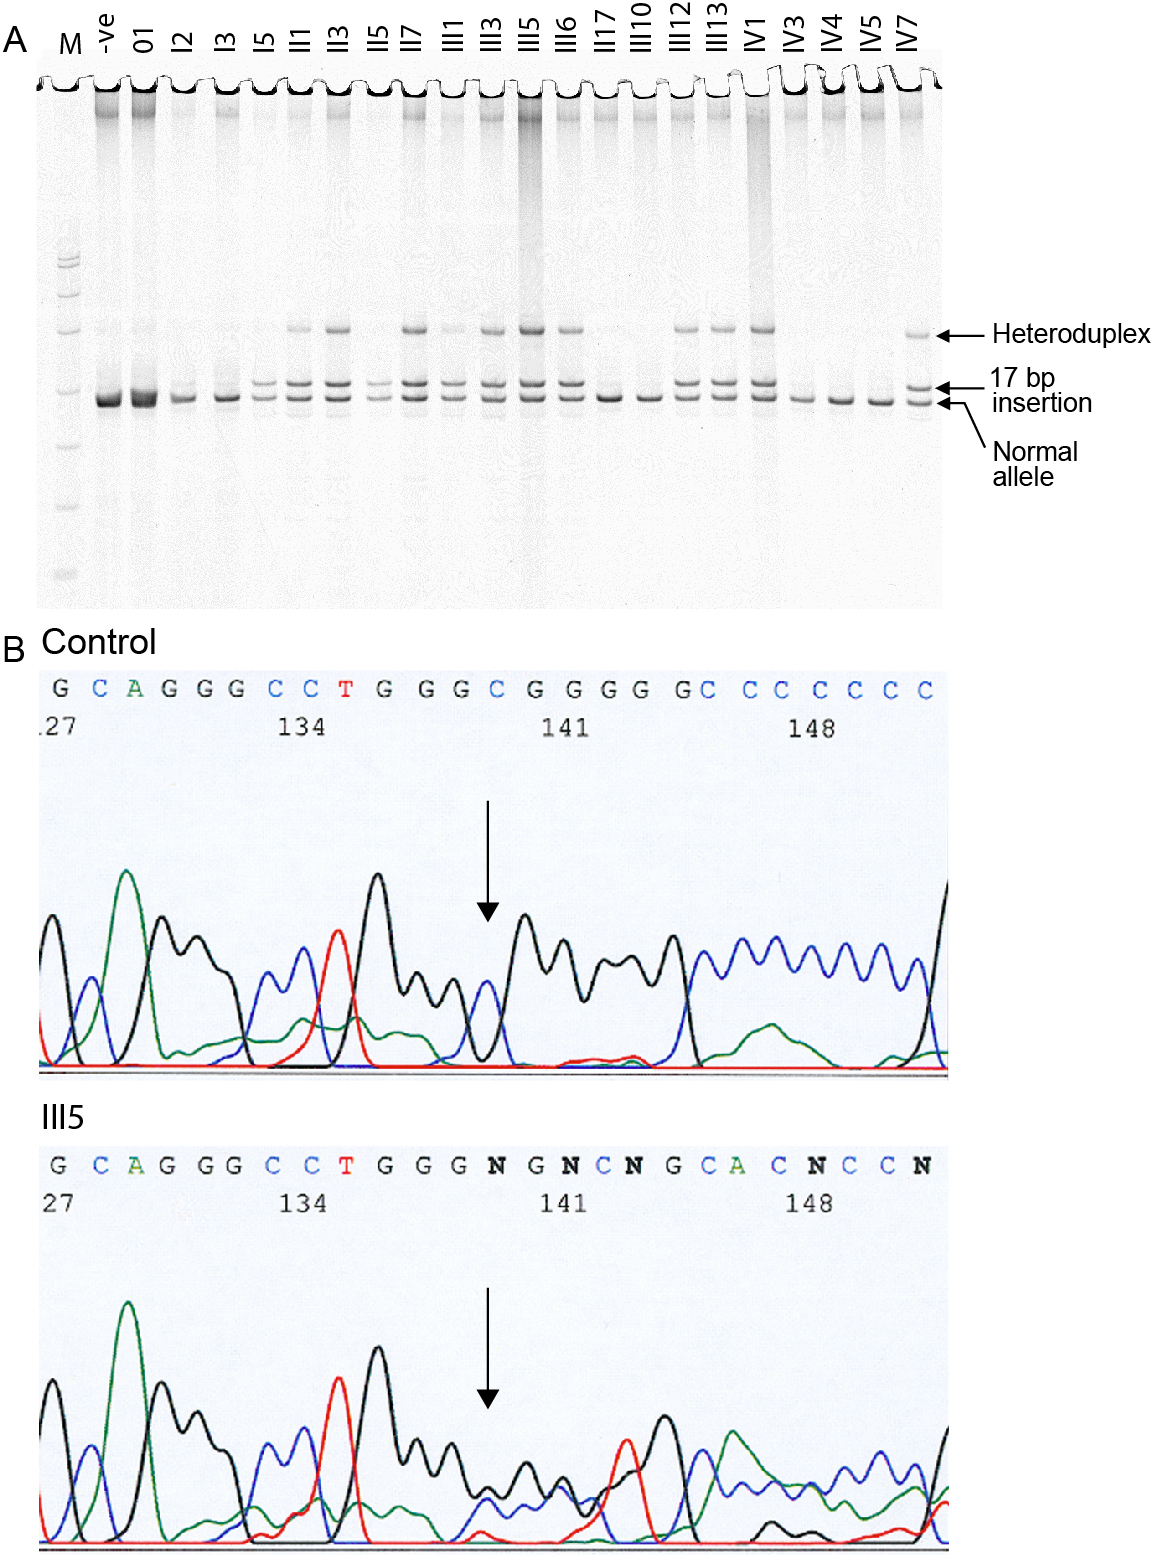
Figure 4. Analysis of exon 4 of PITX3.
A: The gel of amplification products is shown. The 231 bp
band containing the insertion is clearly separated from the 214 bp
band. A heteroduplex band can also be seen in heterozygous individuals.
–ve stands for the unaffected, control individual. M stands for the
molecular weight marker, a HpaII digest of the plasmid pUC19. The bands
either side of the amplification products are 190 and 242 bp. The
heteroduplex runs with the 331 bp band. B: The sequence of exon
4, containing the insertion, for individual III-5 is shown.