Figure 1 of
Fang, Mol Vis 2008; 14:1974-1982.
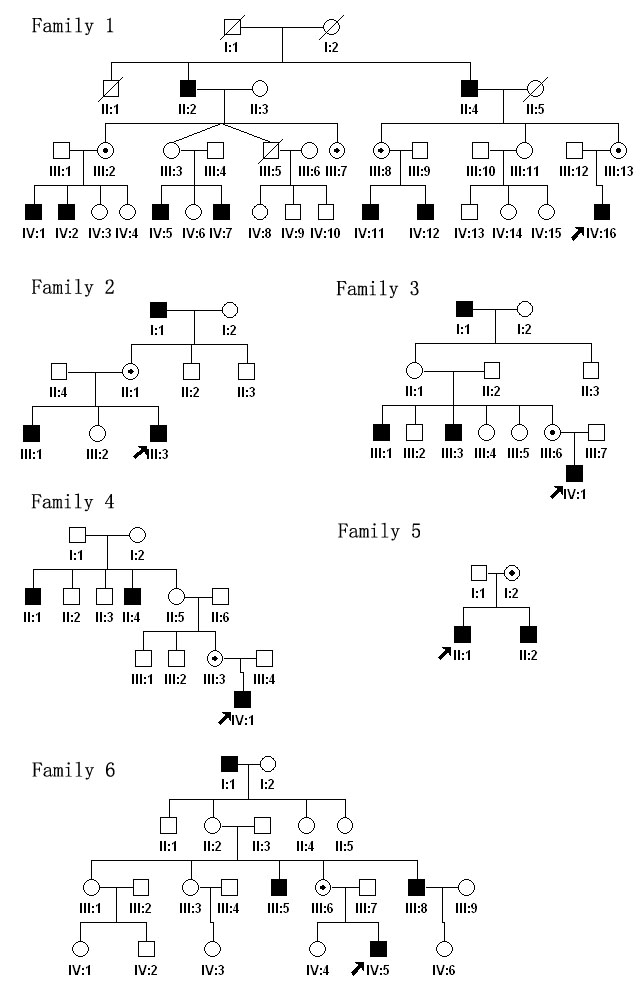
Figure 1.
Pedigrees of the six families are shown. Black filled symbols indicate patients affected with OA1 in each family. Dot-marked symbols represent carriers. The proband is marked by arrow in each family.