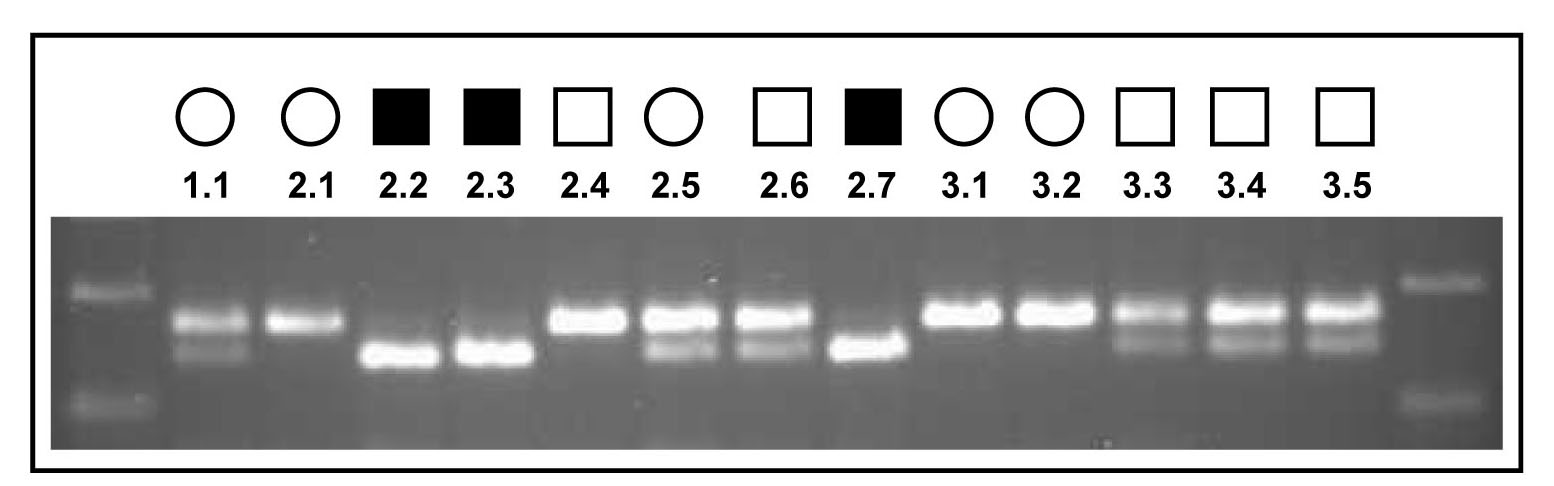
Figure 3. Analysis of the c.316C>A
mutation. Ultraviolet illuminated agarose gel presents BsaWI-digested
PCR products from the DNA of each of the family members. A band size of
168 bp represents an uncut digest that would exist in the presence of a
wildtype sequence. The presence of a digested 140 bp band occurs when a
mutant sequence is present. The 28 bp band following digestion of the
mutant sequence cannot be seen as it has run off the gel. Note the
segregation of the mutation with the disease phenotype so that only the
DNA from the affected individuals gives rise to a single 140 bp band
after digestion of the PCR.