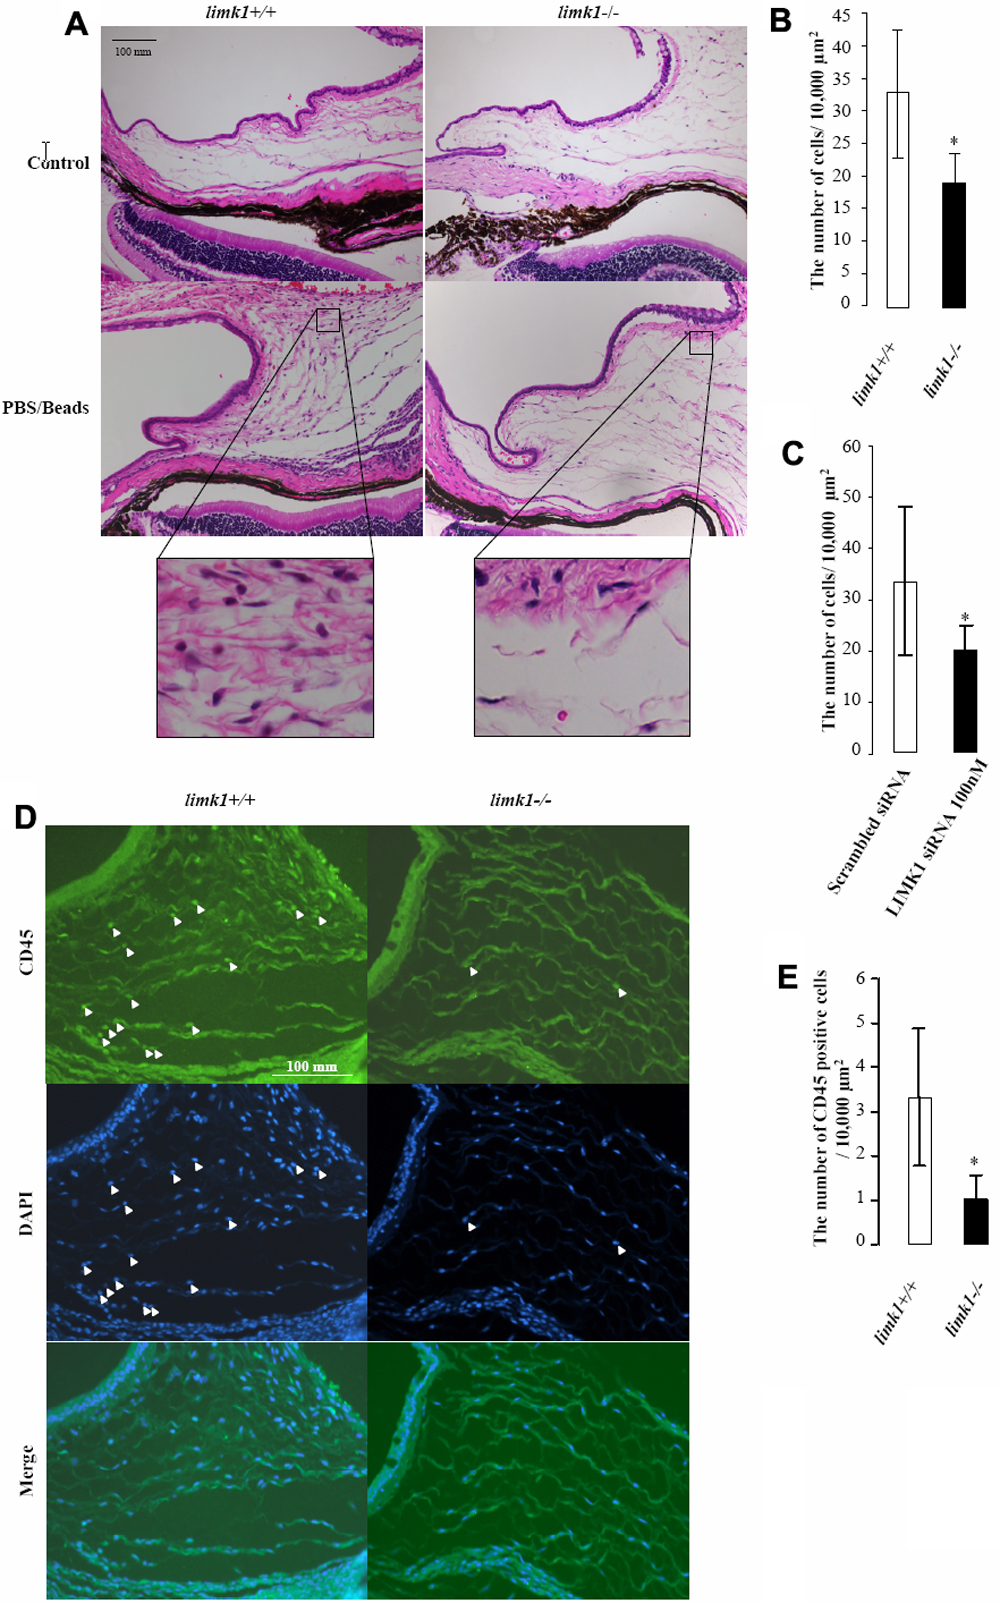
Figure 4. Suppression of inflammatory
response by downregulation of LIMK1 in a mouse model of ocular
inflammation. A: Tissue sections from the mouse eyes of limk1+/+
and limk1−/− genotypes treated with PBS/beads where
indicated. B: Bar graph showing the number of inflammatory
cells per 10,000 μm2 of subconjunctival area in
PBS/beads-injected eyes of limk1+/+ and limk1−/−
mice. The asterisk indicates a p=0. 028 (n=4) compared with limk1+/+
(n=5) specimens. C: Bar graph showing the number of
inflammatory cells per 10,000 µm2 of subconjunctival area in
eyes of mice treated with scrambled siRNA or LIMK1-targeted
siRNA where indicated. The asterisk indicates a p=0. 024 (n=8) compared
with scrambled siRNA controls. D: Immunofluorescence analysis
of leukocyte infiltration in PBS/beads-injected limk1+/+
and limk1−/− mouse eyes. Sections were stained with
anti-CD45 antibody, and the cellularity was assessed by the co-staining
with DAPI. White arrowheads indicate CD45-positive cells. E:
Bar graph showing the number of leukocytes per 10,000 μm2 of
subconjunctival area in the PBS/beads-treated eyes of limk1+/+
(n=5) and limk1−/− (n=4) mice. The asterisk
indicates a p=0.027. Experiments were performed 3 times.