Figure 3. Zymographic analysis of samples
after the enrichment of the minor endonuclease. A: The zymogram
shows progressively increasing endonuclease activity: lane 1, pooled
G-100 fractions “A”; lane 2, fractions with activity pooled from
ConA-Sepharose; lane 3, fractions with activity pooled after oligo (dT)
cellulose chromatography. B: Zymographic gel stained with
silver. Lanes 1–3 are the same as A. The arrow indicates the
position of the minor tear endonuclease activity. M, molecular weight
markers as shown. C: Zymogram of the minor tear endonuclease
(~34 kDa) in the presence (lane 1) and absence (lane 2) of
β−mercaptoethanol.
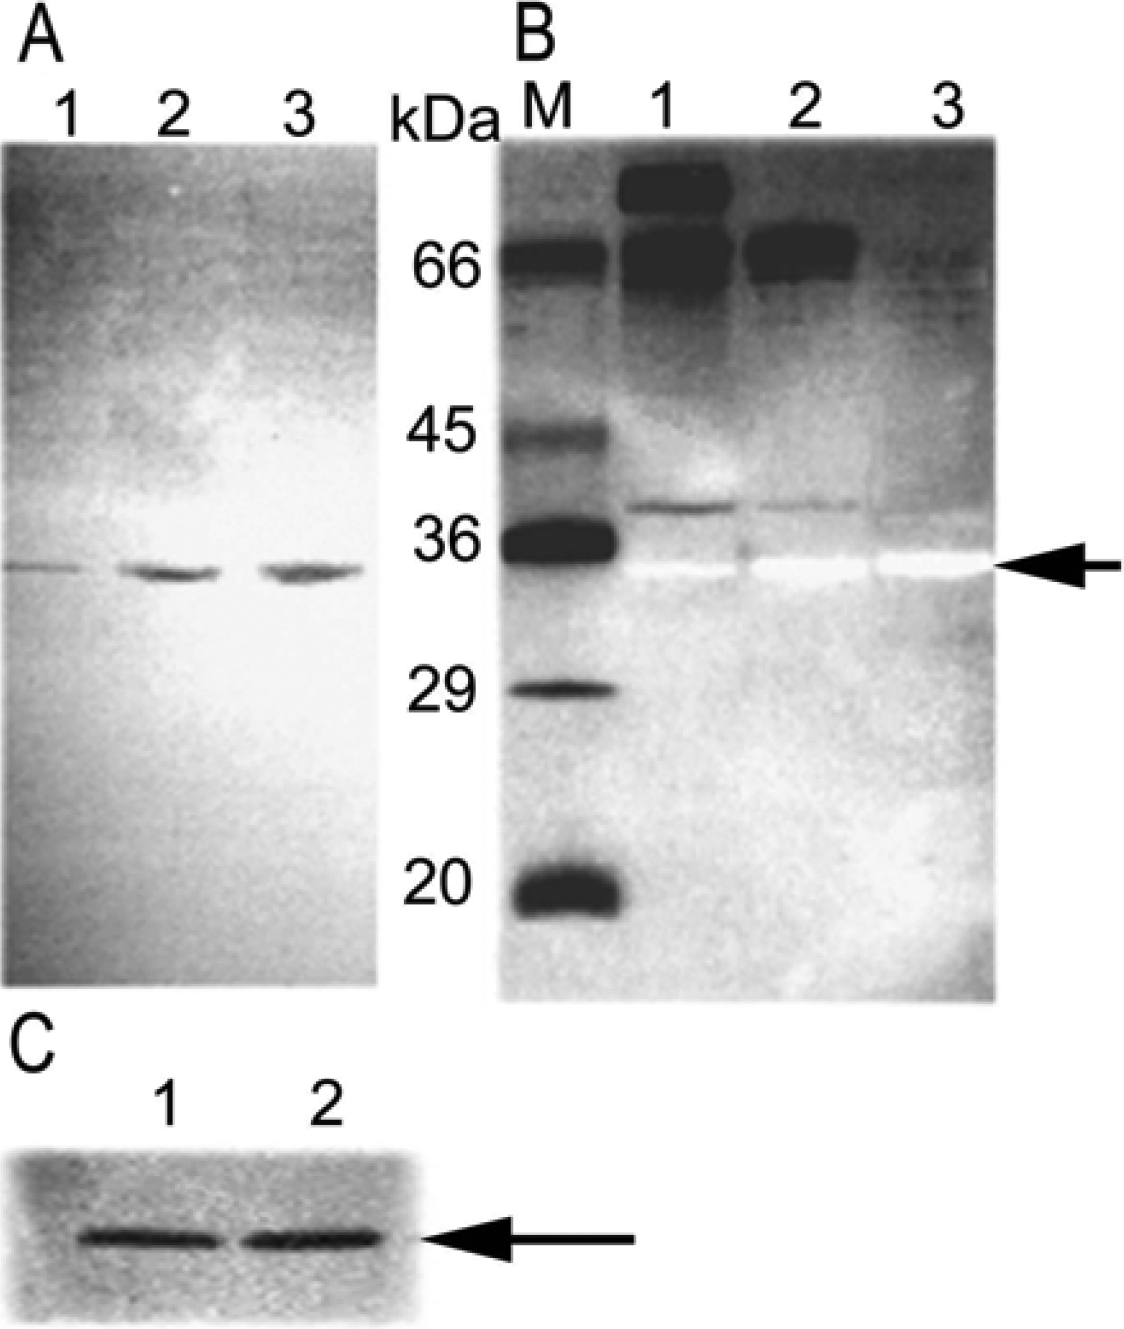
 Figure 3 of Yusifov, Mol Vis 2008; 14:180-188.