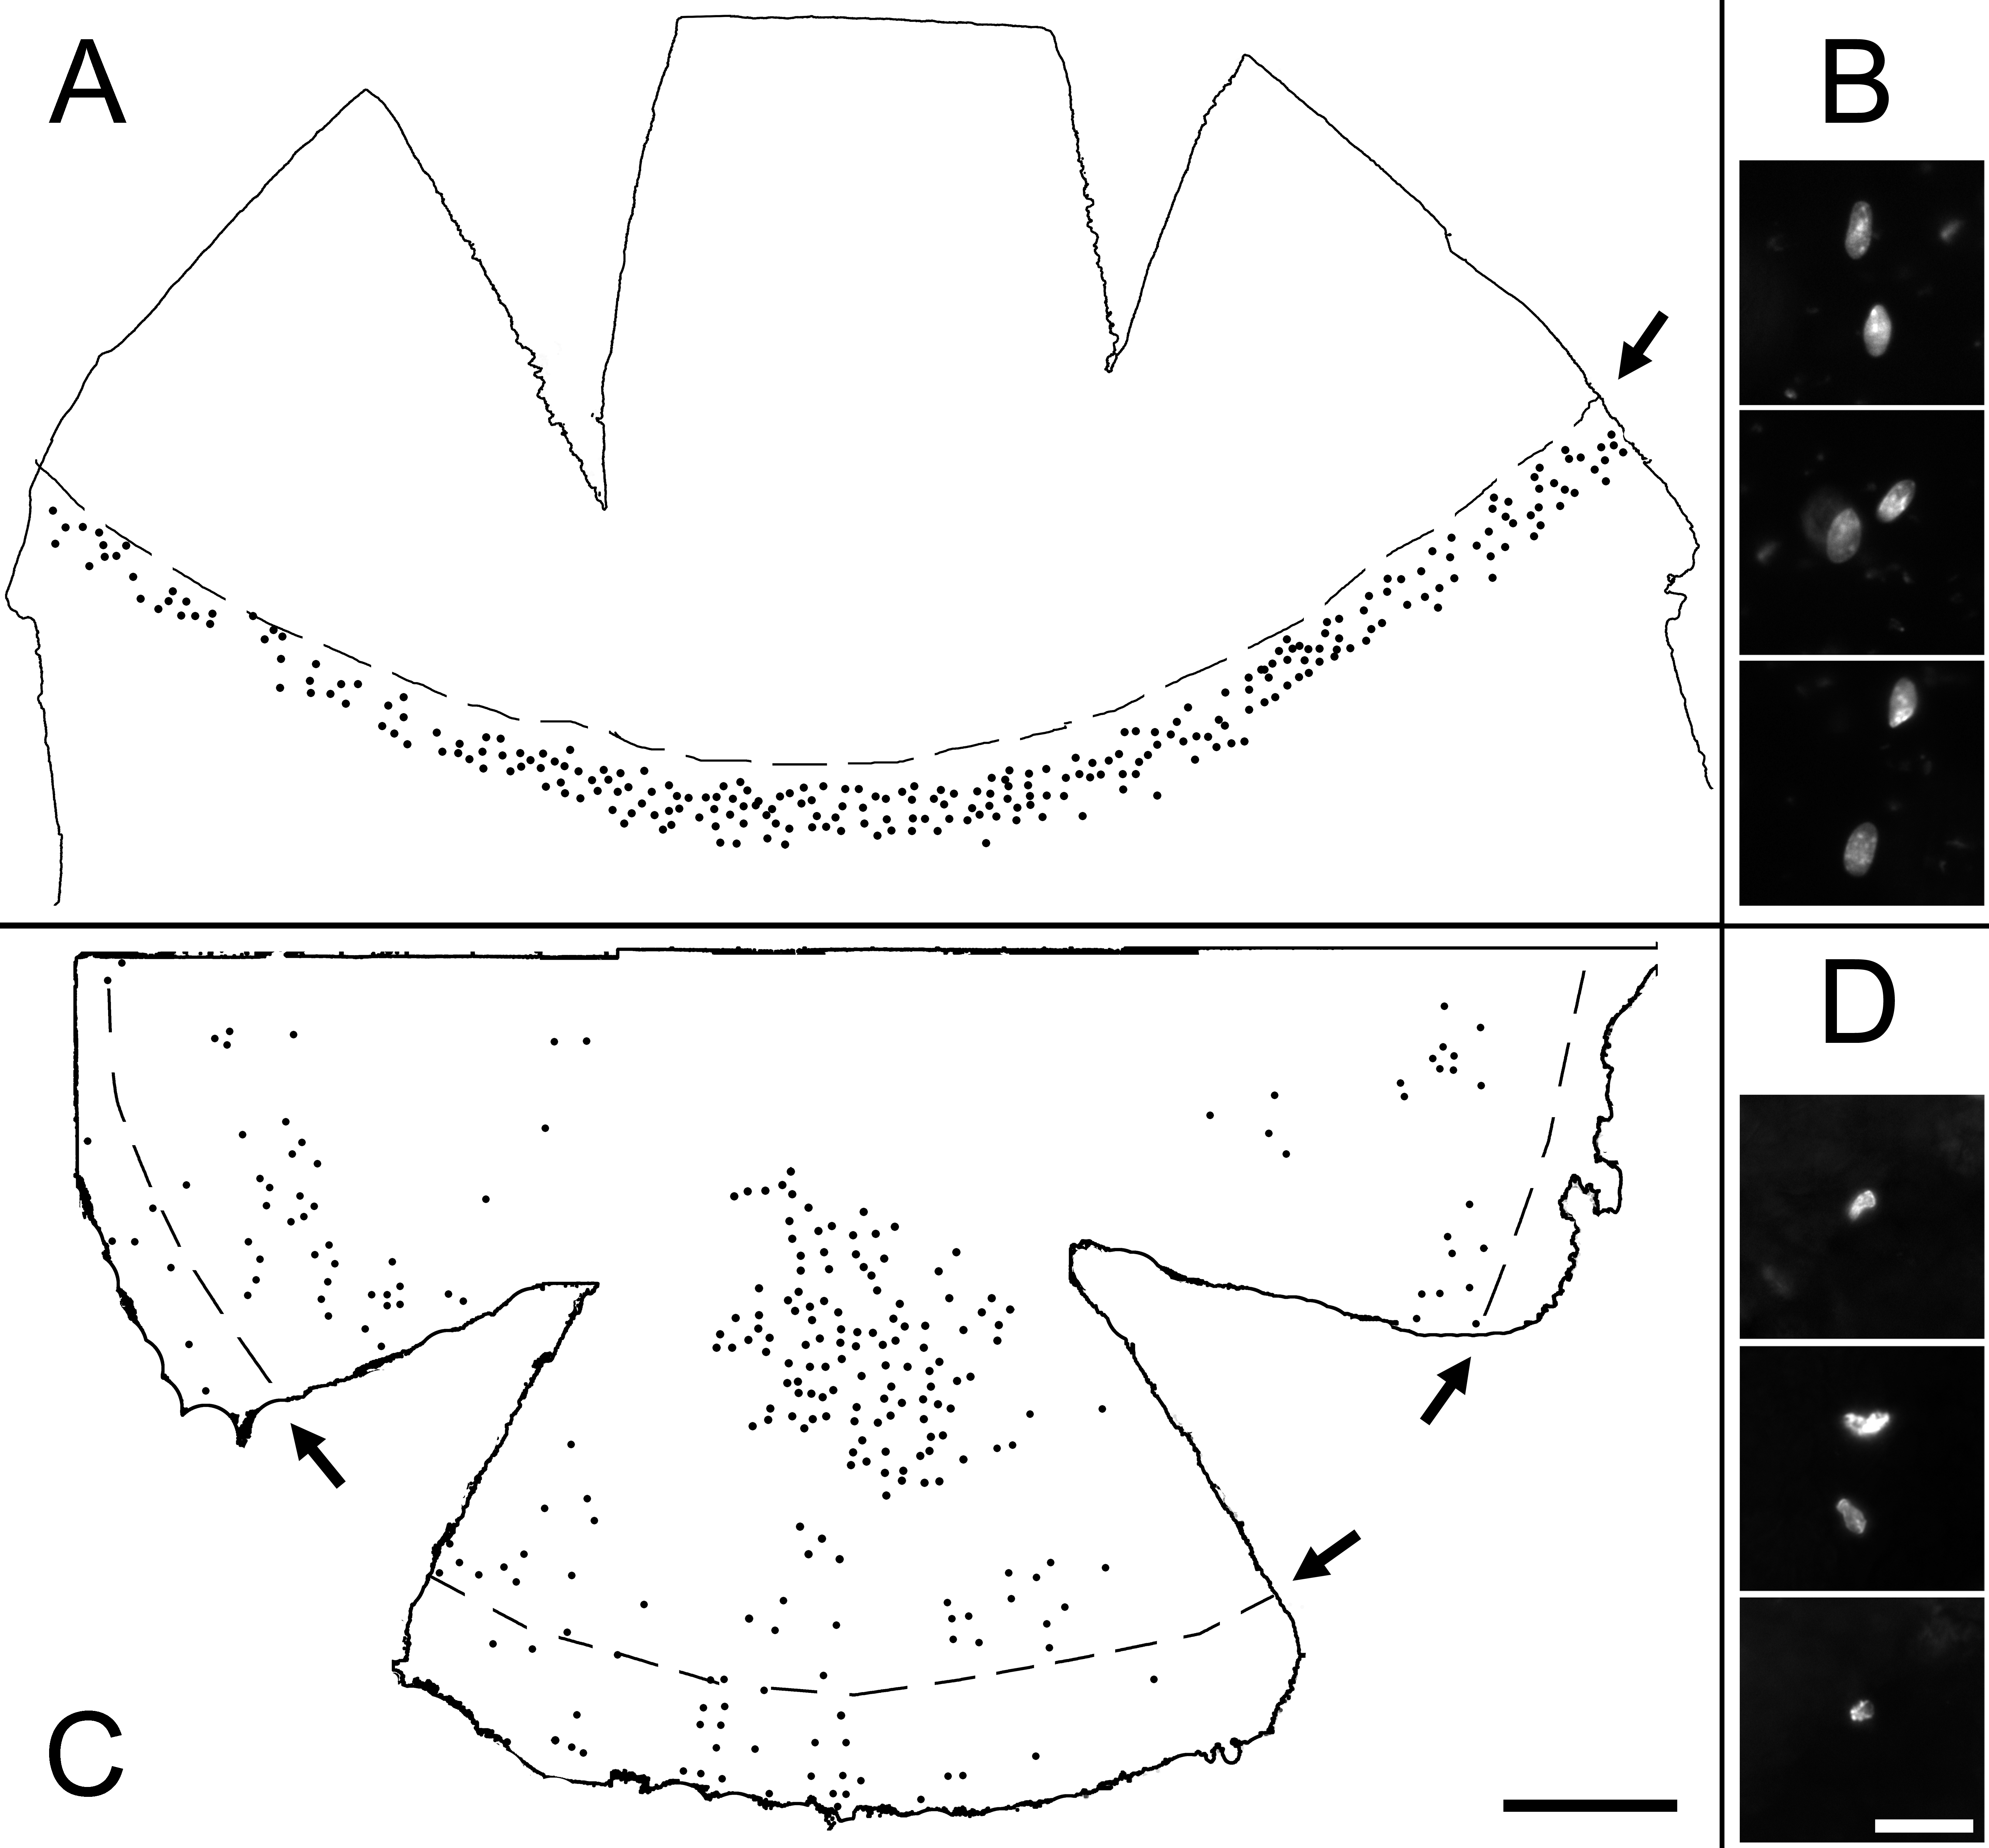
Figure 5. Distribution of corneal LRCs.
LRCs were determined in a
20-week-old CAG-EGFP cornea (A,B)
and a 28-week-old GFP-Dstncorn1 cornea
(C,D) by BrdU
pulse chase labeling followed by BrdU immunohistochemistry. LRCs were
determined by BrdU pulse chase labeling followed by BrdU
immunohistochemistry. They were plotted manually under the microscope,
surveying the entire inferior half of the cornea. Cuts were made to
mount specimens flat either from the corneal side (A) or from
the limbal side (C). An approximate position of a border between
the cornea and the limbus is indicated by arrows and dashed lines. High
power images of representative BrdU positive cells are also shown for a
CAG-EGFP cornea (B) and a GFP-Dstncorn1 cornea
(D). A shows a representation of three CAG-EGFP corneas,
and C shows a representative of eight GFP-Dstncorn1
corneas that all showed similar results. Bar: 500 µm (A,C);
20 µm (B,D).