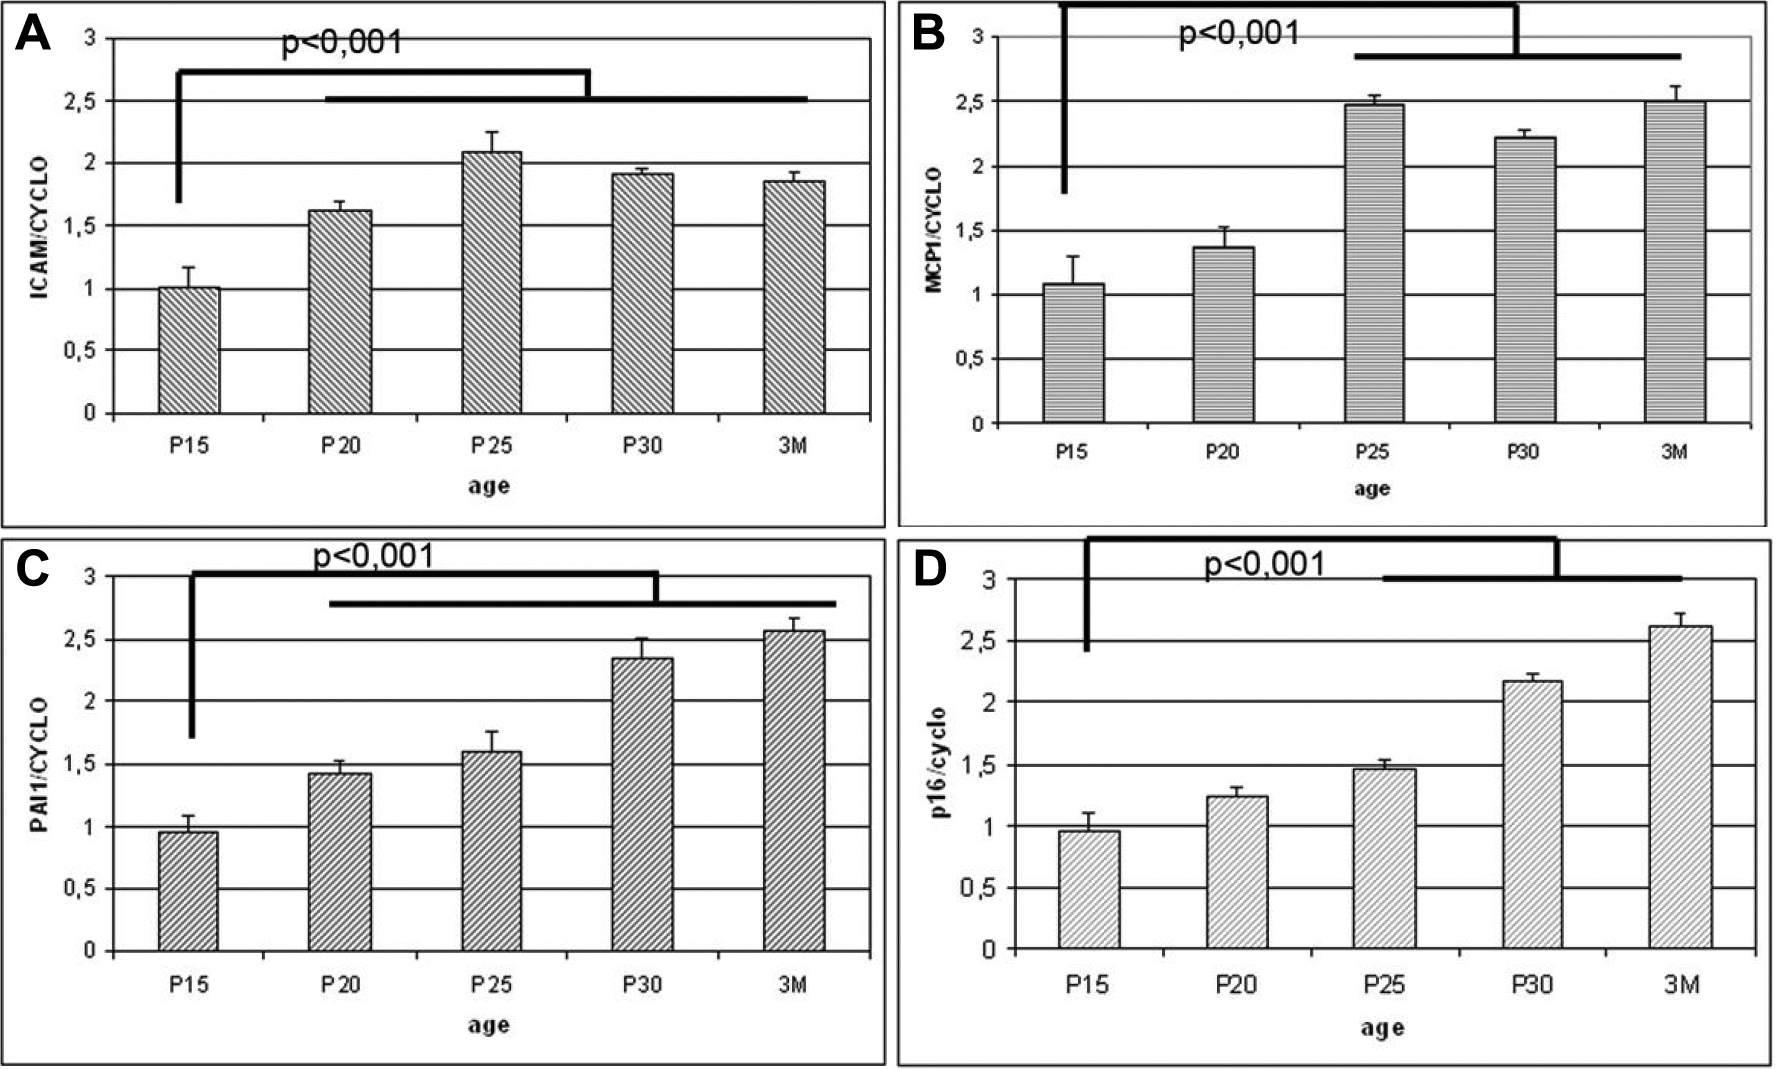
Figure 5. Expression of several known
target genes of ETS-1 and ETS-2. ICAM-1, MCP-1, PAI-1,
and p16 mRNA levels were evaluated by semi-quantitative RT–PCR
and normalized using cyclophilin mRNA as a control. These mRNA levels
were compared with those in control mice of the same age. In A,
we observed that ICAM-1 is upregulated in Tyrp-1 model from p20 to 3
months. In B, we observed that MCP-1 is upregulated in Tyrp-1
model from p25 to 3 months. In C, we observed that PAI-1 is
upregulated in Tyrp-1 model from p20 to 3 months. In D, we
observed that p16 is upregulated in Tyrp-1 model from p25 to 3 months.