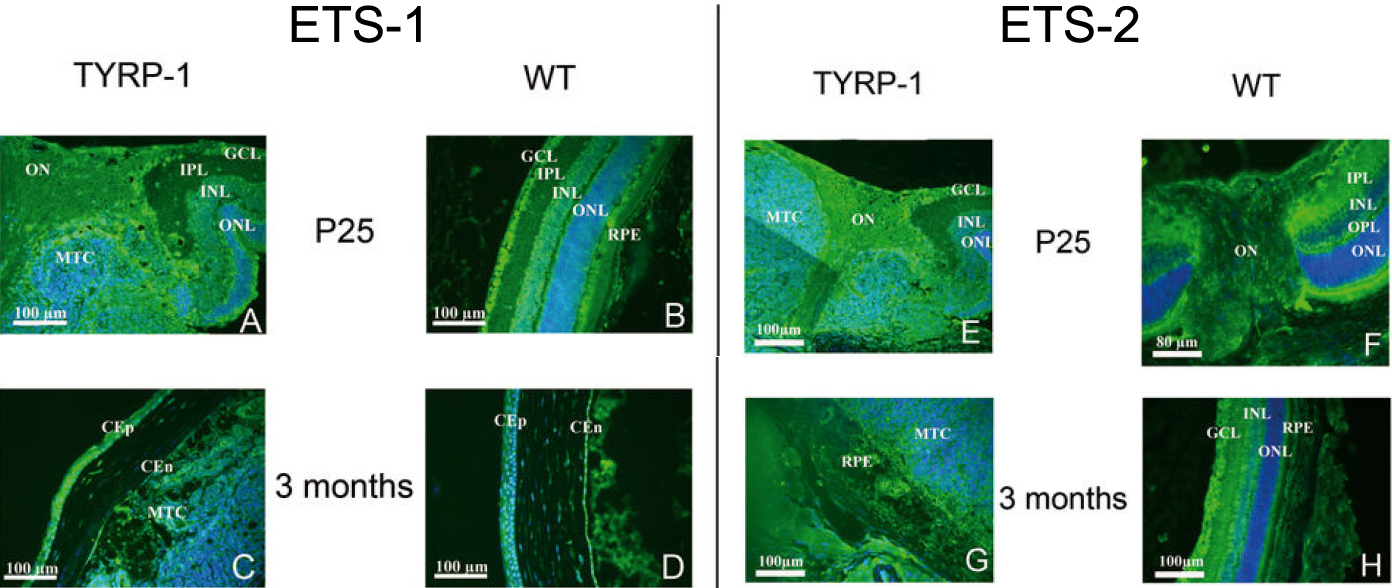
Figure 4. ETS-1 and ETS-2 distribution in
the tumor. We detected ETS-1 protein in the tumor by
immunohistofluorescence on 5 µm paraffin-embedded sections of whole
mouse eyes. Distributions of ETS-1 in the posterior pole of Tyrp-1
transgenic mouse eye tissue sections (A) and in tissue sections
from control mice (B) are shown at P25; ETS-1 is significantly
expressed in the mass of tumor cells. At three months, the melanoma
tumor reaches the cornea of Tyrp-1 transgenic mice eyes (C)
whereas in control mice, only lens fibers can be observed (D).
ETS-1 levels are expressed within the mass of tumor cells (MTC). We
detected ETS-2 protein by immunofluorescence on 5 µm paraffin embedded
tissue sections. Distributions of ETS-2 protein at P25 in the posterior
pole of Tyrp-1 (E) and control mice (F) are also shown;
ETS-2 is significantly expressed in the mass of tumor cells.
Distribution of ETS-2 protein at three months in Tyrp-1 (G) and
control mice (H). ETS-2 is present within all cells contained
within the mass of tumor cells (MTC). The nucleus was counterstained
with DAPI. The scale bar represents 100 µm.